What is Seaborn in data visualization?
Hello everyone, In the Previous blog we see first part of data visualization (Matplotlib) This blog is related to Seaborn. so Let's start:
Keys Feature
- Seaborns is a statistical plotting library
- It has beautiful default style
- It also is designed to work very well with Pandas dataframe object.
Installing and getting started:
To install the latest release of seaborn, you can use:
pip install seaborn
conda install seaborn
Alternatively, you can used pip to install the development version directly from github:
pip install git+https://github.com/mwaskom/seaborn.git
Another option would be to to clone the github repository and install from yours local copy:
pip install . Python 2.7 or 3.5+
Let's see examples of Bar plot:
Bar Plots
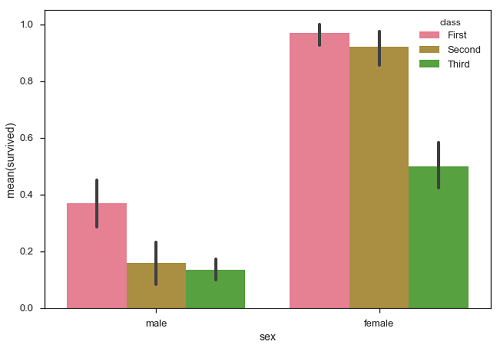
The barplots() shows the relation between a categorical variable and a continuous variable. The data is represented in rectangular bar where the length the bar represent the proportion of the data in that category.
Bar plots represents the estimate of central tendency. Let us use the ‘titanic’ dataset to learn bar plot.
Example
import pandas as pdimport seaborn as sbfrom matplotlib import pyplot as pltdf = sb.load_dataset('titanic')sb.barplot(x = "sex", y = "survived", hue = "class", data = df)plt.show()
Output:

(Note: for detailed please click here )
BEST OF LUCK!!!!!


.png)
.png)


.png)


.png)


0 Comments:
Post a Comment