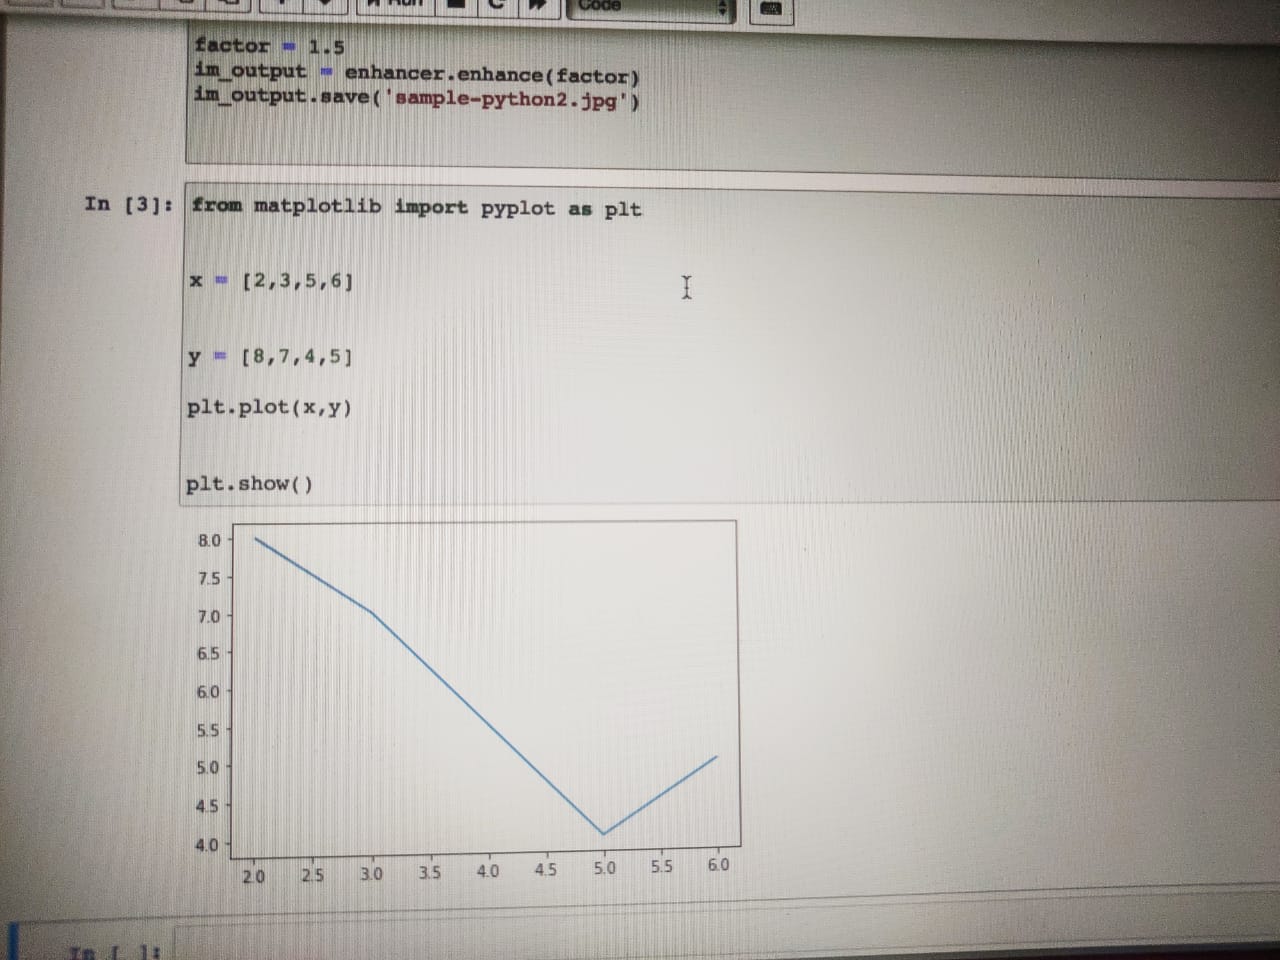
Matplotlib is a plotting library for the Python programming language and its numerical mathematics extension NumPy. It provides an object-oriented API for embedding plots into applications using general-purpose GUI toolkits like Tkinter, wxPython, Qt, or GTK+. There is also a procedural "pylab" interface based on a state machine (like OpenGL), designed to closely resemble that of MATLAB, though its use is discouraged.[3] SciPy makes use of Matplotlib.
Matplotlib was originally written by John D. Hunter, since then it has an active development community,[4] and is distributed under a BSD-style license. Michael Droettboom was nominated as matplotlib's lead developer shortly before John Hunter's death in August 2012,[5] and further joined by Thomas Caswell.[6][7]
Matplotlib 2.0.x supports Python versions 2.7 through 3.6. Python 3 support started with Matplotlib 1.2. Matplotlib 1.4 is the last version to support Python 2.6.[8] Matplotlib has pledged to not support Python 2 past 2020 by signing the Python 3 Statement.


.png)


.png)


0 Comments:
Post a Comment