Thursday, 29 February 2024

Python Coding challenge - Day 139 | What is the output of the following Python Code?


Let's break down the code step by step:

Function Definition:

def custom_function(b):

This line defines a function named custom_function that takes a parameter b.

Conditional Statements:

if b < 0:

    return 20

This block checks if the value of b is less than 0. If it is, the function returns the integer 20.

if b == 0:

    return 20.0

This block checks if the value of b is equal to 0. If it is, the function returns the floating-point number 20.0.

if b > 0:

    return '20'

This block checks if the value of b is greater than 0. If it is, the function returns the string '20'.

Function Call:

print(custom_function(-3))

This line calls the custom_function with the argument -3 and prints the result.

Output Explanation:

The argument is -3, which is less than 0. Therefore, the first condition is true.

The function returns the integer 20.

The print statement then outputs 20.

So, the output of the provided code will be:

20

This is because the function returns the integer 20 when the input is less than 0.

Probabilistic Graphical Models 3: Learning


Build your subject-matter expertise

This course is part of the Probabilistic Graphical Models Specialization

When you enroll in this course, you'll also be enrolled in this Specialization.

Learn new concepts from industry experts

Gain a foundational understanding of a subject or tool

Develop job-relevant skills with hands-on projects

Earn a shareable career certificate

Join Free: Probabilistic Graphical Models 3: Learning

There are 8 modules in this course

Probabilistic graphical models (PGMs) are a rich framework for encoding probability distributions over complex domains: joint (multivariate) distributions over large numbers of random variables that interact with each other. These representations sit at the intersection of statistics and computer science, relying on concepts from probability theory, graph algorithms, machine learning, and more. They are the basis for the state-of-the-art methods in a wide variety of applications, such as medical diagnosis, image understanding, speech recognition, natural language processing, and many, many more. They are also a foundational tool in formulating many machine learning problems. 

This course is the third in a sequence of three. Following the first course, which focused on representation, and the second, which focused on inference, this course addresses the question of learning: how a PGM can be learned from a data set of examples. The course discusses the key problems of parameter estimation in both directed and undirected models, as well as the structure learning task for directed models. The (highly recommended) honors track contains two hands-on programming assignments, in which key routines of two commonly used learning algorithms are implemented and applied to a real-world problem.

Probabilistic Graphical Models 2: Inference


Build your subject-matter expertise

This course is part of the Probabilistic Graphical Models Specialization

When you enroll in this course, you'll also be enrolled in this Specialization.

Learn new concepts from industry experts

Gain a foundational understanding of a subject or tool

Develop job-relevant skills with hands-on projects

Earn a shareable career certificate

Join Free: Probabilistic Graphical Models 2: Inference

There are 7 modules in this course

Probabilistic graphical models (PGMs) are a rich framework for encoding probability distributions over complex domains: joint (multivariate) distributions over large numbers of random variables that interact with each other. These representations sit at the intersection of statistics and computer science, relying on concepts from probability theory, graph algorithms, machine learning, and more. They are the basis for the state-of-the-art methods in a wide variety of applications, such as medical diagnosis, image understanding, speech recognition, natural language processing, and many, many more. They are also a foundational tool in formulating many machine learning problems. 

This course is the second in a sequence of three. Following the first course, which focused on representation, this course addresses the question of probabilistic inference: how a PGM can be used to answer questions. Even though a PGM generally describes a very high dimensional distribution, its structure is designed so as to allow questions to be answered efficiently. The course presents both exact and approximate algorithms for different types of inference tasks, and discusses where each could best be applied. The (highly recommended) honors track contains two hands-on programming assignments, in which key routines of the most commonly used exact and approximate algorithms are implemented and applied to a real-world problem.

Probabilistic Graphical Models 1: Representation


Build your subject-matter expertise

This course is part of the Probabilistic Graphical Models Specialization

When you enroll in this course, you'll also be enrolled in this Specialization.

Learn new concepts from industry experts

Gain a foundational understanding of a subject or tool

Develop job-relevant skills with hands-on projects

Earn a shareable career certificate

Join Free: Probabilistic Graphical Models 1: Representation

There are 7 modules in this course

Probabilistic graphical models (PGMs) are a rich framework for encoding probability distributions over complex domains: joint (multivariate) distributions over large numbers of random variables that interact with each other. These representations sit at the intersection of statistics and computer science, relying on concepts from probability theory, graph algorithms, machine learning, and more. They are the basis for the state-of-the-art methods in a wide variety of applications, such as medical diagnosis, image understanding, speech recognition, natural language processing, and many, many more. They are also a foundational tool in formulating many machine learning problems. 

This course is the first in a sequence of three. It describes the two basic PGM representations: Bayesian Networks, which rely on a directed graph; and Markov networks, which use an undirected graph. The course discusses both the theoretical properties of these representations as well as their use in practice. The (highly recommended) honors track contains several hands-on assignments on how to represent some real-world problems. The course also presents some important extensions beyond the basic PGM representation, which allow more complex models to be encoded compactly.

Evaluations of AI Applications in Healthcare


What you'll learn

Principles and practical considerations for integrating AI into clinical workflows

Best practices of AI applications to promote fair and equitable healthcare solutions

Challenges of regulation of AI applications and which components of a model can be regulated

What standard evaluation metrics do and do not provide

Join Free: Evaluations of AI Applications in Healthcare

There are 7 modules in this course

With artificial intelligence applications proliferating throughout the healthcare system, stakeholders are faced with both opportunities and challenges of these evolving technologies. This course explores the principles of AI deployment in healthcare and the framework used to evaluate downstream effects of AI healthcare solutions.

In support of improving patient care, Stanford Medicine is jointly accredited by the Accreditation Council for Continuing Medical Education (ACCME), the Accreditation Council for Pharmacy Education (ACPE), and the American Nurses Credentialing Center (ANCC), to provide continuing education for the healthcare team. Visit the FAQs below for important information regarding 1) Date of the original release and expiration date; 2) Accreditation and Credit Designation statements; 3) Disclosure of financial relationships for every person in control of activity content.

Fundamentals of Machine Learning for Healthcare


What you'll learn

Define important relationships between the fields of machine learning, biostatistics, and traditional computer programming.

Learn about advanced neural network architectures for tasks ranging from text classification to object detection and segmentation.

Learn important approaches for leveraging data to train, validate, and test machine learning models.

Understand how dynamic medical practice and discontinuous timelines impact clinical machine learning application development and deployment.

Join Free: Fundamentals of Machine Learning for Healthcare

There are 8 modules in this course

Machine learning and artificial intelligence hold the potential to transform healthcare and open up a world of incredible promise. But we will never realize the potential of these technologies unless all stakeholders have basic competencies in both healthcare and machine learning concepts and principles. 

This course will introduce the fundamental concepts and principles of machine learning as it applies to medicine and healthcare. We will explore machine learning approaches, medical use cases, metrics unique to healthcare, as well as best practices for designing, building, and evaluating machine learning applications in healthcare.

The course will empower those with non-engineering backgrounds in healthcare, health policy, pharmaceutical development, as well as data science with the knowledge to critically evaluate and use these technologies.

Co-author: Geoffrey Angus
 
Contributing Editors:
Mars Huang
Jin Long
Shannon Crawford
Oge Marques


In support of improving patient care, Stanford Medicine is jointly accredited by the Accreditation Council for Continuing Medical Education (ACCME), the Accreditation Council for Pharmacy Education (ACPE), and the American Nurses Credentialing Center (ANCC), to provide continuing education for the healthcare team. Visit the FAQs below for important information regarding 1) Date of the original release and expiration date; 2) Accreditation and Credit Designation statements; 3) Disclosure of financial relationships for every person in control of activity content.

Tuesday, 27 February 2024

Python Data Science Handbook: Essential Tools for Working with Data


Python is a first-class tool for many researchers, primarily because of its libraries for storing, manipulating, and gaining insight from data. Several resources exist for individual pieces of this data science stack, but only with the new edition of Python Data Science Handbook do you get them all—IPython, NumPy, pandas, Matplotlib, Scikit-Learn, and other related tools.

Working scientists and data crunchers familiar with reading and writing Python code will find the second edition of this comprehensive desk reference ideal for tackling day-to-day issues: manipulating, transforming, and cleaning data; visualizing different types of data; and using data to build statistical or machine learning models. Quite simply, this is the must-have reference for scientific computing in Python.

With this handbook, you'll learn how:

IPython and Jupyter provide computational environments for scientists using Python

NumPy includes the ndarray for efficient storage and manipulation of dense data arrays

Pandas contains the DataFrame for efficient storage and manipulation of labeled/columnar data

Matplotlib includes capabilities for a flexible range of data visualizations

Scikit-learn helps you build efficient and clean Python implementations of the most important and established machine learning algorithms

Join Free: Python Data Science Handbook: Essential Tools for Working with Data

Foundations of Data Science with Python (Chapman & Hall/CRC The Python Series)


Foundations of Data Science with Python introduces readers to the fundamentals of data science, including data manipulation and visualization, probability, statistics, and dimensionality reduction. This book is targeted toward engineers and scientists, but it should be readily understandable to anyone who knows basic calculus and the essentials of computer programming. It uses a computational-first approach to data science: the reader will learn how to use Python and the associated data-science libraries to visualize, transform, and model data, as well as how to conduct statistical tests using real data sets. Rather than relying on obscure formulas that only apply to very specific statistical tests, this book teaches readers how to perform statistical tests via resampling; this is a simple and general approach to conducting statistical tests using simulations that draw samples from the data being analyzed. The statistical techniques and tools are explained and demonstrated using a diverse collection of data sets to conduct statistical tests related to contemporary topics, from the effects of socioeconomic factors on the spread of the COVID-19 virus to the impact of state laws on firearms mortality.

This book can be used as an undergraduate textbook for an Introduction to Data Science course or to provide a more contemporary approach in courses like Engineering Statistics. However, it is also intended to be accessible to practicing engineers and scientists who need to gain foundational knowledge of data science.

Key Features:

Applies a modern, computational approach to working with data

Uses real data sets to conduct statistical tests that address a diverse set of contemporary issues

Teaches the fundamentals of some of the most important tools in the Python data-science stack

Provides a basic, but rigorous, introduction to Probability and its application to Statistics

Offers an accompanying website that provides a unique set of online, interactive tools to help the reader learn the material

Hard Copy: Foundations of Data Science with Python (Chapman & Hall/CRC The Python Series)

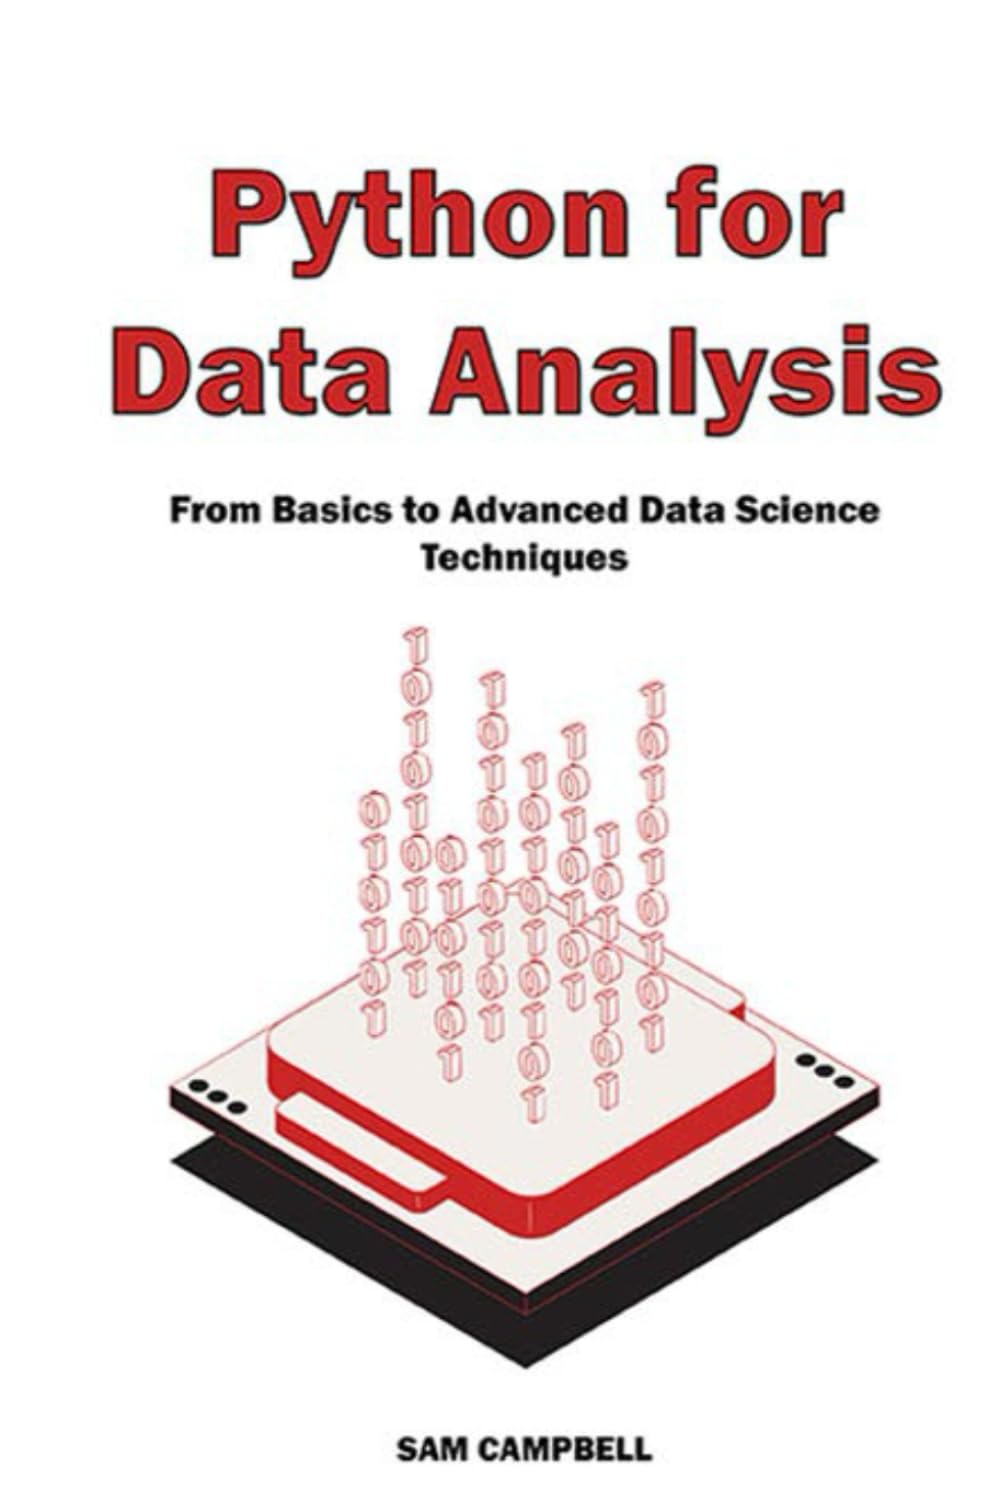
Python for Data Analysis: From Basics to Advanced Data Science Techniques


Unlock the power of Python to analyze data, uncover insights, and drive decision-making with "Python for Data Analysis: From Basics to Advanced Data Science Techniques" Whether you're new to data analysis or looking to enhance your skills, this book offers a comprehensive journey through the tools, techniques, and concepts that make Python the go-to choice for data professionals.

Inside, you'll discover:

Foundational Python: Start from the basics of Python programming, including setting up your environment, understanding Python syntax, and exploring core concepts.

Mastering Pandas for Data Manipulation: Dive deep into Pandas for data cleaning, preparation, and manipulation, empowering you to handle and explore real-world datasets with ease.

Data Visualization Techniques: Learn to communicate your findings visually with Matplotlib and Seaborn, creating compelling and informative plots that bring your data to life.

Machine Learning Integration: Step into the world of machine learning with Scikit-Learn to apply predictive models to your data, from basic classification to complex regression tasks.

Advanced Data Analysis: Explore advanced topics, including working with big data using Dask, natural language processing (NLP), and an introduction to deep learning with TensorFlow and Keras.

Practical Projects and Case Studies: Apply what you've learned with hands-on projects and case studies that simulate real-world data analysis scenarios, enhancing your problem-solving skills and practical knowledge.

Future of Data Analysis: Look ahead to the emerging trends in data analysis and the ethical considerations of working with data, preparing you for the future of the field.

"Python for Data Analysis: From Basics to Advanced Data Science Techniques" is more than just a book; it's a comprehensive guide to becoming proficient in data analysis using Python. With clear explanations, practical examples, and step-by-step instructions, this book will equip you with the knowledge and skills you need to navigate the data landscape confidently and become an invaluable asset in your organization or field.

Hard Copy: Python for Data Analysis: From Basics to Advanced Data Science Techniques

Python for Data Science: A Hands-On Introduction


A hands-on, real-world introduction to data analysis with the Python programming language, loaded with wide-ranging examples.

Python is an ideal choice for accessing, manipulating, and gaining insights from data of all kinds. Python for Data Science introduces you to the Pythonic world of data analysis with a learn-by-doing approach rooted in practical examples and hands-on activities. You’ll learn how to write Python code to obtain, transform, and analyze data, practicing state-of-the-art data processing techniques for use cases in business management, marketing, and decision support.

You will discover Python’s rich set of built-in data structures for basic operations, as well as its robust ecosystem of open-source libraries for data science, including NumPy, pandas, scikit-learn, matplotlib, and more. Examples show how to load data in various formats, how to streamline, group, and aggregate data sets, and how to create charts, maps, and other visualizations. Later chapters go in-depth with demonstrations of real-world data applications, including using location data to power a taxi service, market basket analysis to identify items commonly purchased together, and machine learning to predict stock prices.

Hard Copy: Python for Data Science: A Hands-On Introduction


Data Engineering with AWS: Acquire the skills to design and build AWS-based data transformation pipelines like a pro 2nd ed. Edition


Looking to revolutionize your data transformation game with AWS? Look no further! From strong foundations to hands-on building of data engineering pipelines, our expert-led manual has got you covered.

Key Features

Delve into robust AWS tools for ingesting, transforming, and consuming data, and for orchestrating pipelines

Stay up to date with a comprehensive revised chapter on Data Governance

Build modern data platforms with a new section covering transactional data lakes and data mesh

Book Description

This book, authored by a seasoned Senior Data Architect with 25 years of experience, aims to help you achieve proficiency in using the AWS ecosystem for data engineering. This revised edition provides updates in every chapter to cover the latest AWS services and features, takes a refreshed look at data governance, and includes a brand-new section on building modern data platforms which covers; implementing a data mesh approach, open-table formats (such as Apache Iceberg), and using DataOps for automation and observability.

You'll begin by reviewing the key concepts and essential AWS tools in a data engineer's toolkit and getting acquainted with modern data management approaches. You'll then architect a data pipeline, review raw data sources, transform the data, and learn how that transformed data is used by various data consumers. You’ll learn how to ensure strong data governance, and about populating data marts and data warehouses along with how a data lakehouse fits into the picture. After that, you'll be introduced to AWS tools for analyzing data, including those for ad-hoc SQL queries and creating visualizations. Then, you'll explore how the power of machine learning and artificial intelligence can be used to draw new insights from data. In the final chapters, you'll discover transactional data lakes, data meshes, and how to build a cutting-edge data platform on AWS.

By the end of this AWS book, you'll be able to execute data engineering tasks and implement a data pipeline on AWS like a pro!

What you will learn

Seamlessly ingest streaming data with Amazon Kinesis Data Firehose

Optimize, denormalize, and join datasets with AWS Glue Studio

Use Amazon S3 events to trigger a Lambda process to transform a file

Load data into a Redshift data warehouse and run queries with ease

Visualize and explore data using Amazon QuickSight

Extract sentiment data from a dataset using Amazon Comprehend

Build transactional data lakes using Apache Iceberg with Amazon Athena

Learn how a data mesh approach can be implemented on AWS

Who this book is for

This book is for data engineers, data analysts, and data architects who are new to AWS and looking to extend their skills to the AWS cloud. Anyone new to data engineering who wants to learn about the foundational concepts, while gaining practical experience with common data engineering services on AWS, will also find this book useful. A basic understanding of big data-related topics and Python coding will help you get the most out of this book, but it’s not a prerequisite. Familiarity with the AWS console and core services will also help you follow along.

Table of Contents

An Introduction to Data Engineering

Data Management Architectures for Analytics

The AWS Data Engineer’s Toolkit

Data Governance, Security, and Cataloging

Architecting Data Engineering Pipelines

Ingesting Batch and Streaming Data

Transforming Data to Optimize for Analytics

Identifying and Enabling Data Consumers

A Deeper Dive into Data Marts and Amazon Redshift

Orchestrating the Data Pipeline

Hard Copy: Data Engineering with AWS: Acquire the skills to design and build AWS-based data transformation pipelines like a pro 2nd ed. Edition


Monday, 26 February 2024

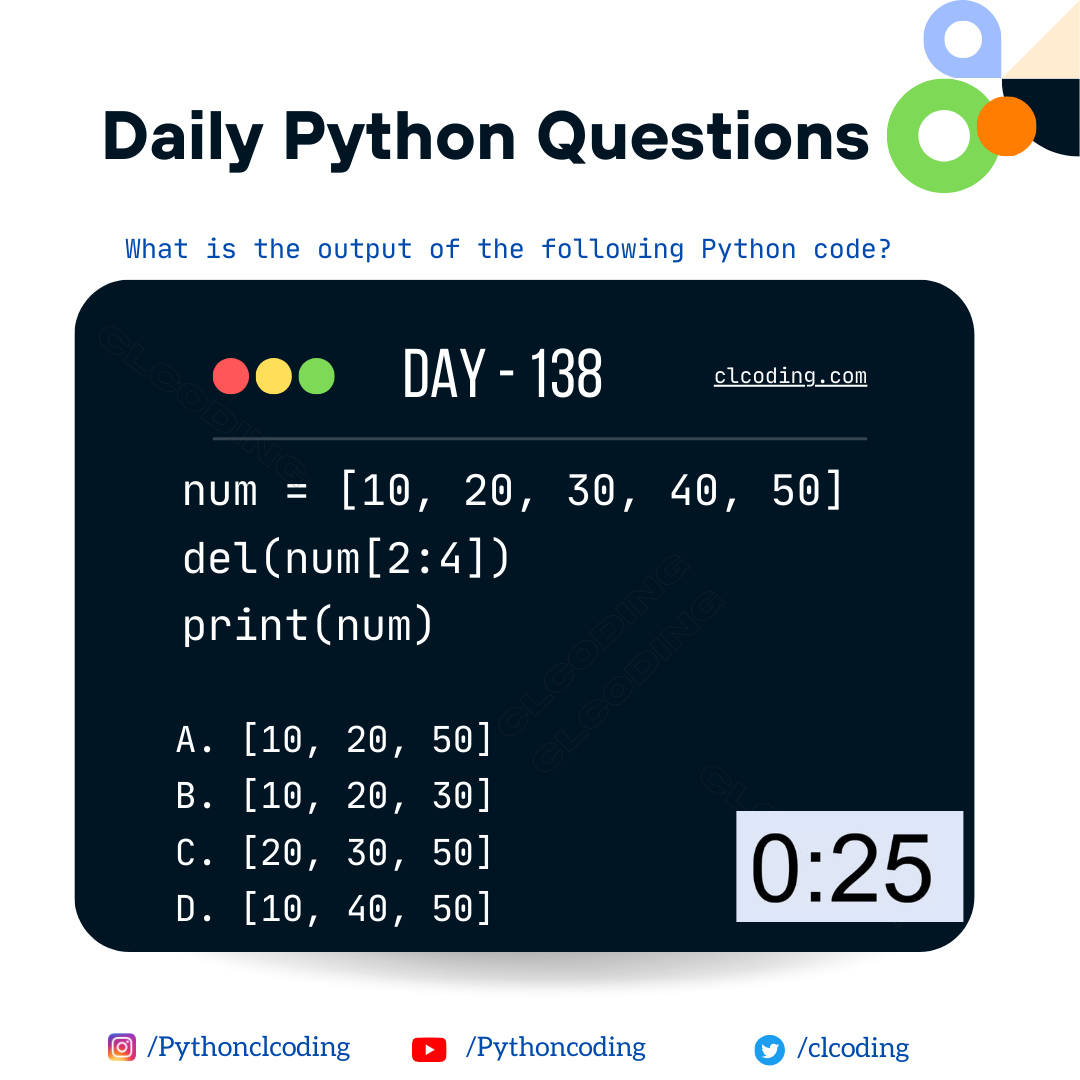
Python Coding challenge - Day 138 | What is the output of the following Python Code?


The above code deletes elements from index 2 to index 3 (not including index 4) in the list num and then prints the updated list. Let's break it down:

num = [10, 20, 30, 40, 50]

This line initializes a list named num with the elements 10, 20, 30, 40, and 50.

del(num[2:4])

This line uses the del statement to delete elements from index 2 up to (but not including) index 4 in the list. So, it removes the elements at index 2 and 3 (30 and 40) from the list.

After this operation, the list num becomes [10, 20, 50].

print(num)

Finally, the code prints the updated list, which is [10, 20, 50].

So, the output of the code will be:

[10, 20, 50]

IBM Data Analytics with Excel and R Professional Certificate


What you'll learn

Master the most up-to-date practical skills and knowledge data analysts use in their daily roles

Learn how to perform data analysis, including data preparation, statistical analysis, and predictive modeling using R, R Studio, and Jupyter

Utilize Excel spreadsheets to perform a variety of data analysis tasks like data wrangling, using pivot tables, data mining, & creating charts

Communicate your data findings using various data visualization techniques including, charts, plots & interactive dashboards with Cognos and R Shiny

Join Free: IBM Data Analytics with Excel and R Professional Certificate

Professional Certificate - 9 course series

Prepare for the in-demand field of data analytics. In this program, you’ll learn high valued skills like Excel, Cognos Analytics, and R programming language to get job-ready in less than 3 months.

Data analytics is a strategy-based science where data is analyzed to find trends, answer questions, shape business processes, and aid decision-making. This Professional Certificate focuses on data analysis using Microsoft Excel and R programming language. If you’re interested in using Python, please explore the IBM Data Analyst PC. 

This program will teach you the foundational data skills employers are seeking for entry level data analytics roles and will provide a portfolio of projects and a Professional Certificate from IBM to showcase your expertise to potential employers.

You’ll learn the latest skills and tools used by professional data analysts and upon successful completion of this program, you will be able to work with Excel spreadsheets, Jupyter Notebooks, and R Studio to analyze data and create visualizations. You will also use the R programming language to complete the entire data analysis process,  including data preparation, statistical analysis, data visualization, predictive modeling and creating interactive dashboards. Lastly, you’ll learn how to communicate your data findings and prepare a summary report.

This program is ACE® and FIBAA recommended—when you complete, you can earn up to 15 college credits and 4 ECTS credits.

Applied Learning Project

You will complete hands-on labs to build your portfolio and  gain practical experience with Excel, Cognos Analytics, SQL, and the R programing language and related libraries for data science, including Tidyverse, Tidymodels, R Shiny, ggplot2, Leaflet, and rvest.

Projects include:

Analyzing fleet vehicle inventory data using pivot tables.

Using key performance indicator (KPI) data from car sales to create an interactive dashboard.

Identifying patterns in countries’ COVID-19 testing data rates using R.

Using SQL with the RODBC R package to analyze foreign grain markets.

Creating linear and polynomial regression models and comparing them with weather station data to predict precipitation.

Using the R Shiny package to create a dashboard that examines trends in census data.

Using hypothesis testing and predictive modeling skills to build an interactive dashboard with the R Shiny package and a dynamic Leaflet map widget to investigate how weather affects bike-sharing demand.

Predict Sales Revenue with scikit-learn


What you'll learn

Build simple linear regression models in Python

Apply scikit-learn and statsmodels to regression problems

Employ explorartory data analysis (EDA) with seaborn and pandas

Explain linear regression to both technical and non-technical audiences

Join Free: Predict Sales Revenue with scikit-learn

About this Guided Project

In this 2-hour long project-based course, you will build and evaluate a simple linear regression model using Python. You will employ the scikit-learn module for calculating the linear regression, while using pandas for data management, and seaborn for plotting. You will be working with the very popular Advertising data set to predict sales revenue based on advertising spending through mediums such as TV, radio, and newspaper. 

By the end of this course, you will be able to:

- Explain the core ideas of linear regression to technical and non-technical audiences
- Build a simple linear regression model in Python with scikit-learn
- Employ Exploratory Data Analysis (EDA) to small data sets with seaborn and pandas
- Evaluate a simple linear regression model using appropriate metrics

This course runs on Coursera's hands-on project platform called Rhyme. On Rhyme, you will get instant access to pre-configured cloud desktops containing all of the software and data you need for the project. Everything is already set up directly in your internet browser so you can just focus on learning. For this project, you’ll get instant access to a cloud desktop with Jupyter and Python 3.7 with all the necessary libraries pre-installed.

Notes:

- You will be able to access the cloud desktop 5 times. However, you will be able to access instructions videos as many times as you want.
- This course works best for learners who are based in the North America region. We’re currently working on providing the same experience in other regions.

Generative AI: Enhance your Data Analytics Career


What you'll learn

Describe how you can use Generative AI tools and techniques in the context of data analytics across industries

Implement various data analytic processes such as data preparation, analysis, visualization and storytelling using Generative AI tools

Evaluate real-world case studies showcasing the successful application of Generative AI in deriving meaningful insights 

 Analyze the ethical considerations and challenges associated with using Generative AI in data analytics

Join Free: Generative AI: Enhance your Data Analytics Career

There are 3 modules in this course

This comprehensive course unravels the potential of generative AI in data analytics. The course will provide an in-depth knowledge of the fundamental concepts, models, tools, and generative AI applications regarding the data analytics landscape. 

In this course, you will examine real-world applications and use generative AI to gain data insights using techniques such as prompts, visualization, storytelling, querying and so on. In addition, you will understand the ethical implications, considerations, and challenges of using generative AI in data analytics across different industries.

You will acquire practical experience through hands-on labs where you will leverage generative AI models and tools such as ChatGPT, ChatCSV, Mostly.AI, SQLthroughAI and more.

Finally, you will apply the concepts learned throughout the course to a data analytics project. Also, you will have an opportunity to test your knowledge with practice and graded quizzes and earn a certificate. 

This course is suitable for both practicing data analysts as well as learners aspiring to start a career in data analytics. It requires some basic knowledge of data analytics, prompt engineering, Python programming and generative artificial intelligence.

Data Analyst Career Guide and Interview Preparation


What you'll learn

Describe the role of a data analyst and some career path options as well as the prospective opportunities in the field.

Explain how to build a foundation for a job search, including researching job listings, writing a resume, and making a portfolio of work.

Summarize what a candidate can expect during a typical job interview cycle, different types of interviews, and how to prepare for interviews.

Explain how to give an effective interview, including techniques for answering questions and how to make a professional personal presentation.

Join Free: Data Analyst Career Guide and Interview Preparation

There are 4 modules in this course

Data analytics professionals are in high demand around the world, and the trend shows no sign of slowing. There are lots of great jobs available, but lots of great candidates too. How can you get the edge in such a competitive field?

This course will prepare you to enter the job market as a great candidate for a data analyst position. It provides practical techniques for creating essential job-seeking materials such as a resume and a portfolio, as well as auxiliary tools like a cover letter and an elevator pitch. You will learn how to find and assess prospective job positions, apply to them, and lay the groundwork for interviewing. 

The course doesn’t stop there, however. You will also get inside tips and steps you can use to perform professionally and effectively at interviews. You will learn how to approach a take-home challenges and get to practice completing them. Additionally, it provides information about the regular functions and tasks of data analysts, as well as the opportunities of the profession and some options for career development.

You will get guidance from a number of experts in the data industry through the course. They will discuss their own career paths and talk about what they have learned about networking, interviewing, solving coding problems, and fielding other questions you may encounter as a candidate. Let seasoned data analysis professionals share their experience to help you get ahead and land the job you want.

Machine Learning With Big Data


Build your subject-matter expertise

This course is part of the Big Data Specialization

When you enroll in this course, you'll also be enrolled in this Specialization.

Learn new concepts from industry experts

Gain a foundational understanding of a subject or tool

Develop job-relevant skills with hands-on projects

Earn a shareable career certificate

Join Free: Machine Learning With Big Data

There are 7 modules in this course

Want to make sense of the volumes of data you have collected?  Need to incorporate data-driven decisions into your process?  This course provides an overview of machine learning techniques to explore, analyze, and leverage data.  You will be introduced to tools and algorithms you can use to create machine learning models that learn from data, and to scale those models up to big data problems.

At the end of the course, you will be able to:

Design an approach to leverage data using the steps in the machine learning process.
Apply machine learning techniques to explore and prepare data for modeling.
Identify the type of machine learning problem in order to apply the appropriate set of techniques.
Construct models that learn from data using widely available open source tools.
Analyze big data problems using scalable machine learning algorithms on Spark.

Sunday, 25 February 2024

Python Coding challenge - Day 137 | What is the output of the following Python Code?


a = [1, 2, 3, 4]

b = [1, 2, 5]

print(a < b)

Two lists, a and b, are defined.

a is [1, 2, 3, 4]

b is [1, 2, 5]

The code uses the less-than (<) operator to compare the two lists a and b. This comparison is performed element-wise.

The first elements of both lists are equal (1 == 1).

The second elements are equal (2 == 2).

The third elements are different (3 in a and 5 in b).

The less-than comparison stops at the first differing element. Since 3 is less than 5, the entire comparison evaluates to True.

The result of the comparison is printed using print(a < b), and it will output True.

So, the output of the code is:

True

This is because, in lexicographical order, the list a is considered less than the list b due to the first differing element at index 2.

Saturday, 24 February 2024

3D contour plot using Python


import numpy as np

import matplotlib.pyplot as plt
from mpl_toolkits.mplot3d import Axes3D

# Create a meshgrid of x and y values
x = np.linspace(-5, 5, 100)
y = np.linspace(-5, 5, 100)
X, Y = np.meshgrid(x, y)

# Define a function to calculate the z values (height) based on x and y
def f(x, y):
    return np.sin(np.sqrt(x**2 + y**2))

# Calculate the z values for the meshgrid
Z = f(X, Y)

# Create a three-dimensional contour plot
fig = plt.figure(figsize=(8, 6))
ax = fig.add_subplot(111, projection='3d')
contour = ax.contour3D(X, Y, Z, 50, cmap='viridis')

# Add labels and a colorbar
ax.set_xlabel('X-axis')
ax.set_ylabel('Y-axis')
ax.set_zlabel('Z-axis')
fig.colorbar(contour, ax=ax, label='Z values')

# Show the plot
plt.show()

#clcoding.com

Text wrapping using Python Libraries


In [4]:
I love
Python
Coding

Friday, 23 February 2024

Lists data structures in Python


Example 1: Creating a List

In [2]:
[1, 2, 3, 4, 5]
['apple', 'banana', 'orange']
[1, 'hello', 3.14, True]
[]

Example 2: Accessing Elements in a List

In [3]:
apple
5
[2, 3, 4]
['apple', 'banana']

Example 3: Modifying Elements in a List

In [4]:
['apple', 'grape', 'orange']
['apple', 'grape', 'orange', 'kiwi']
['apple', 'grape', 'orange', 'kiwi', 'mango']

Example 4: Removing Elements from a List

In [4]:
['apple', 'grape', 'kiwi', 'mango', 'pineapple']
Popped fruit: grape
['apple', 'kiwi', 'mango', 'pineapple']

Example 5: List Operations

In [5]:
4
True
[1, 2, 3, 4, 5, 6, 7, 8]

Example 6: List Iteration

In [6]:
Fruit: apple
Fruit: kiwi
Fruit: mango
Fruit: pineapple
Index: 0, Fruit: apple
Index: 1, Fruit: kiwi
Index: 2, Fruit: mango
Index: 3, Fruit: pineapple

Popular Posts

Categories

100 Python Programs for Beginner (95) AI (38) Android (24) AngularJS (1) Assembly Language (2) aws (17) Azure (7) BI (10) book (4) Books (184) C (77) C# (12) C++ (83) Course (67) Coursera (236) Cybersecurity (25) Data Analytics (2) data management (11) Data Science (138) Data Strucures (8) Deep Learning (21) Django (14) Downloads (3) edx (2) Engineering (14) Euron (22) Excel (13) Factorial (1) Finance (6) flask (3) flutter (1) FPL (17) Generative AI (5) Google (34) Hadoop (3) HTML Quiz (1) HTML&CSS (47) IBM (30) IoT (1) IS (25) Java (93) Java quiz (1) Leet Code (4) Machine Learning (67) Meta (22) MICHIGAN (5) microsoft (4) Nvidia (4) Pandas (4) PHP (20) Projects (29) pyth (1) Python (965) Python Coding Challenge (411) Python Quiz (62) Python Tips (3) Questions (2) R (70) React (6) Scripting (1) security (3) Selenium Webdriver (4) Software (17) SQL (42) UX Research (1) web application (8) Web development (4) web scraping (2)

Followers

Person climbing a staircase. Learn Data Science from Scratch: online program with 21 courses