Saturday, 16 March 2024

Basics of Coding - Lecture 1


1. What is coding?

->Coding refers to the process of creating instructions for a computer to

perform specific tasks. It involves writing lines of code using a programming

language that follows a defined syntax and set of rules.

Coding can be used to create software applications, websites, algorithms, and

much more. It is a fundamental skill in the field of computer science and in

essential for anyone interested in software development, data analysis,

machine learning, and various other technological domains.

2. What is algorithm?

->An algorithm is a set of clear and specific instructions that guide the

computer to solve a problem or complete a task efficiently and accurately. It’s

like a recipe that tells the computer exactly what do to achieve a desired

outcome.

3. Who created Python?

-> Python was created by Guido van Rossum. He started developing Python in

the late 1980s, and the first version of the programming language was released

in 1991.

4. What is Python?

->Python is a popular and easy to learn programming language. It is known for

it’s simplicity and readability, making it a great choice for beginners. Python is

versatile and can be used for a wide range of tasks, from web development to

data analysis and artificial intelligence. It’s clear syntax and extensive library

support make it efficient and productive for software development. Overall,

Python is a powerful yet user-friendly language that is widely used in the tech

industry.

Assignment Questions

1. Declare two variables, x and y, and assign them the values 5

and 3, respectively. Calculate their sum and print the result.

2. Declare a variable radius and assign it a value of 7. Calculate the

area of a circle with that radius and print the result.


3. Declare a variable temperature and assign it a value of 25.

Convert the temperature from Celsius to Fahrenheit and print the

result.

4. Declare three variables a, b, and c and assign them the values

10, 3.5, and 2, respectively. Calculate the result of a divided by the

product of b and c and print the result.

5. Declare a variable initial_amount and assign it a value of 1000.

Calculate the compound interest after one year with an interest rate

of 5% and print the result.

6. Declare a variable seconds and assign it a value of 86400.

Convert the seconds into hours, minutes, and seconds, and print the

result in the format: "hh:mm:ss".

7. Declare a variable numerator and assign it a value of 27.

Declare another variable denominator and assign it a value of 4.

Calculate the integer division and remainder of numerator divided by

denominator and print both results.

8. Declare a variable length and assign it a value of 10. Calculate

the perimeter and area of a square with that length and print the

results.

Friday, 15 March 2024

The json library in Python


The json library in Python

1. Encoding Python Data to JSON:

import json

# Python dictionary to be encoded to JSON

data = {

    "name": "John",

    "age": 30,

    "city": "New York"

}

# Encode the Python dictionary to JSON

json_data = json.dumps(data)

print("Encoded JSON:", json_data)


#clcoding.com

Encoded JSON: {"name": "John", "age": 30, "city": "New York"}

2. Decoding JSON to Python Data:

import json

# JSON data to be decoded to Python

json_data = '{"name": "John", "age": 30, "city": "New York"}'

# Decode the JSON data to a Python dictionary

data = json.loads(json_data)

print("Decoded Python Data:", data)

#clcoding.com

Decoded Python Data: {'name': 'John', 'age': 30, 'city': 'New York'}

3. Reading JSON from a File:

clcoding

import json

# Read JSON data from a file

with open('clcoding.json', 'r') as file:

    data = json.load(file)

print("JSON Data from File:", data)

#clcoding.com

JSON Data from File: {'We are supporting freely to everyone. Join us for live support. \n\nWhatApp Support: wa.me/919767292502\n\nInstagram Support : https://www.instagram.com/pythonclcoding/\n\nFree program: https://www.clcoding.com/\n\nFree Codes: https://clcoding.quora.com/\n\nFree Support: pythonclcoding@gmail.com\n\nLive Support: https://t.me/pythonclcoding\n\nLike us: https://www.facebook.com/pythonclcoding\n\nJoin us: https://www.facebook.com/groups/pythonclcoding': None}

4. Writing JSON to a File:

import json

# Python dictionary to be written to a JSON file

data = {

    "name": "John",

    "age": 30,

    "city": "New York"

}

# Write the Python dictionary to a JSON file

with open('output.json', 'w') as file:

    json.dump(data, file)

    #clcoding.com

5. Handling JSON Errors:

import json

# JSON data with syntax error

json_data = '{"name": "John", "age": 30, "city": "New York"'

try:

    # Attempt to decode JSON data

    data = json.loads(json_data)

except json.JSONDecodeError as e:

    # Handle JSON decoding error

    print("Error decoding JSON:", e)

    #clcoding.com

Error decoding JSON: Expecting ',' delimiter: line 1 column 47 (char 46)

Thursday, 14 March 2024

Python Coding challenge - Day 149 | What is the output of the following Python Code?


Let's break down the given code:

for i in range(1, 3):

    print(i, end=' - ')

This code snippet is a for loop in Python. Let's go through it step by step:

for i in range(1, 3)::

This line initiates a loop where i will take on values from 1 to 2 (inclusive). The range() function generates a sequence of numbers starting from the first argument (1 in this case) up to, but not including, the second argument (3 in this case).

So, the loop will iterate with i taking on the values 1 and 2.

print(i, end=' - '):

Within the loop, this line prints the current value of i, followed by a dash (-), without moving to the next line due to the end=' - ' parameter.

So, during each iteration of the loop, it will print the value of i followed by a dash and space.

When you execute this code, it will output:

1 - 2 - 

Explanation: The loop runs for each value of i in the range (1, 3), which are 1 and 2. For each value of i, it prints the value followed by a dash and space. So, the output is 1 - 2 - .


Learn hashlib library in Python


1. Hashing Strings:

import hashlib

# Hash a string using SHA256 algorithm

string_to_hash = "Hello, World!"

hashed_string = hashlib.sha256(string_to_hash.encode()).hexdigest()

print("Original String:", string_to_hash)

print("Hashed String:", hashed_string)

#clcoding.com 

Original String: Hello, World!

Hashed String: dffd6021bb2bd5b0af676290809ec3a53191dd81c7f70a4b28688a362182986f

2. Hashing Files:

#clcoding.com 

import hashlib

def calculate_file_hash(file_path, algorithm='sha256'):

    # Choose the hash algorithm

    hash_algorithm = getattr(hashlib, algorithm)()

    # Read the file in binary mode and update the hash object

    with open(file_path, 'rb') as file:

        for chunk in iter(lambda: file.read(4096), b''):

            hash_algorithm.update(chunk)

    # Get the hexadecimal representation of the hash value

    hash_value = hash_algorithm.hexdigest()

    return hash_value

# Example usage

file_path = 'example.txt'

file_hash = calculate_file_hash(file_path)

print("SHA-256 Hash of the file:", file_hash)

#clcoding.com 

SHA-256 Hash of the file: e3b0c44298fc1c149afbf4c8996fb92427ae41e4649b934ca495991b7852b855

3. Using Different Hash Algorithms:

import hashlib

# Hash a string using different algorithms

string_to_hash = "Hello, World!"

# MD5

md5_hash = hashlib.md5(string_to_hash.encode()).hexdigest()

# SHA1

sha1_hash = hashlib.sha1(string_to_hash.encode()).hexdigest()

# SHA512

sha512_hash = hashlib.sha512(string_to_hash.encode()).hexdigest()

print("MD5 Hash:", md5_hash)

print("SHA1 Hash:", sha1_hash)

print("SHA512 Hash:", sha512_hash)

#clcoding.com 

MD5 Hash: 65a8e27d8879283831b664bd8b7f0ad4

SHA1 Hash: 0a0a9f2a6772942557ab5355d76af442f8f65e01

SHA512 Hash: 374d794a95cdcfd8b35993185fef9ba368f160d8daf432d08ba9f1ed1e5abe6cc69291e0fa2fe0006a52570ef18c19def4e617c33ce52ef0a6e5fbe318cb0387

4. Hashing Passwords (Securely):

import hashlib

# Hash a password securely using a salt

password = "my_password"

salt = "random_salt"


hashed_password = hashlib.pbkdf2_hmac('sha256', password.encode(), salt.encode(), 100000)

hashed_password_hex = hashed_password.hex()

print("Salted and Hashed Password:", hashed_password_hex)


#clcoding.com 

Salted and Hashed Password: b18597b62cda4415c995eaff30f61460da8ff4d758d3880f80593ed5866dcf98

5. Verifying Passwords:

import hashlib

# Verify a password against a stored hash

stored_hash = "stored_hashed_password"

def verify_password(password, stored_hash):

    input_hash = hashlib.sha256(password.encode()).hexdigest()

    if input_hash == stored_hash:

        return True

    else:

        return False

password_to_verify = "password_to_verify"

if verify_password(password_to_verify, stored_hash):

    print("Password is correct!")

else:

    print("Password is incorrect.")


#clcoding.com 

Password is incorrect.

6. Hashing a String using SHA-256:

import hashlib

# Create a hash object

hash_object = hashlib.sha256()

# Update the hash object with the input data

input_data = b'Hello, World!'

hash_object.update(input_data)

# Get the hexadecimal representation of the hash value

hash_value = hash_object.hexdigest()

print("SHA-256 Hash:", hash_value)

#clcoding.com 

SHA-256 Hash: dffd6021bb2bd5b0af676290809ec3a53191dd81c7f70a4b28688a362182986f

7. Hashing a String using MD5:

import hashlib

# Create a hash object

hash_object = hashlib.md5()

# Update the hash object with the input data

input_data = b'Hello, World!'

hash_object.update(input_data)

# Get the hexadecimal representation of the hash value

hash_value = hash_object.hexdigest()

print("MD5 Hash:", hash_value)

#clcoding.com 

MD5 Hash: 65a8e27d8879283831b664bd8b7f0ad4


Wednesday, 13 March 2024

Learn psutil library in Python 🧵:


Learn psutil library in Python

pip install psutil

1. Getting CPU Information:

import psutil

# Get CPU information

cpu_count = psutil.cpu_count()

cpu_percent = psutil.cpu_percent(interval=1)


print("CPU Count:", cpu_count)

print("CPU Percent:", cpu_percent)


#clcoding.com 

CPU Count: 8

CPU Percent: 6.9

2. Getting Memory Information:

import psutil

# Get memory information

memory = psutil.virtual_memory()

total_memory = memory.total

available_memory = memory.available

used_memory = memory.used

percent_memory = memory.percent

print("Total Memory:", total_memory)

print("Available Memory:", available_memory)

print("Used Memory:", used_memory)

print("Memory Percent:", percent_memory)

#clcoding.com

Total Memory: 8446738432

Available Memory: 721600512

Used Memory: 7725137920

Memory Percent: 91.5

3. Listing Running Processes:

import psutil

# List running processes

for process in psutil.process_iter():

    print(process.pid, process.name())

    #clcoding.com

0 System Idle Process

4 System

124 Registry

252 chrome.exe

408 PowerToys.Peek.UI.exe

436 msedge.exe

452 svchost.exe

504 smss.exe

520 svchost.exe

532 RuntimeBroker.exe

544 TextInputHost.exe

548 svchost.exe

680 csrss.exe

704 fontdrvhost.exe

768 wininit.exe

776 chrome.exe

804 chrome.exe

848 services.exe

924 lsass.exe

1036 WUDFHost.exe

1100 svchost.exe

1148 svchost.exe

1160 SgrmBroker.exe

1260 dllhost.exe

1284 PowerToys.exe

1328 svchost.exe

1392 svchost.exe

1400 svchost.exe

1408 svchost.exe

1488 svchost.exe

1504 svchost.exe

1512 svchost.exe

1600 SmartAudio3.exe

1608 svchost.exe

1668 svchost.exe

1716 svchost.exe

1724 IntelCpHDCPSvc.exe

1732 svchost.exe

1752 svchost.exe

1796 TiWorker.exe

1828 svchost.exe

1920 chrome.exe

1972 svchost.exe

1992 svchost.exe

2016 svchost.exe

2052 svchost.exe

2060 svchost.exe

2068 IntelCpHeciSvc.exe

2148 igfxCUIService.exe

2168 svchost.exe

2224 svchost.exe

2260 svchost.exe

2316 svchost.exe

2360 chrome.exe

2364 svchost.exe

2400 MsMpEng.exe

2420 svchost.exe

2428 svchost.exe

2448 PowerToys.FancyZones.exe

2480 screenrec.exe

2488 svchost.exe

2496 svchost.exe

2504 svchost.exe

2552 svchost.exe

2604 svchost.exe

2616 MemCompression

2716 svchost.exe

2792 chrome.exe

2796 dasHost.exe

2804 chrome.exe

2852 svchost.exe

2876 svchost.exe

2932 CxAudioSvc.exe

3016 svchost.exe

3240 svchost.exe

3416 svchost.exe

3480 svchost.exe

3536 spoolsv.exe

3620 svchost.exe

3660 svchost.exe

3700 svchost.exe

3752 RuntimeBroker.exe

3848 taskhostw.exe

3976 svchost.exe

3984 svchost.exe

3992 svchost.exe

4000 svchost.exe

4008 svchost.exe

4016 svchost.exe

4024 svchost.exe

4032 svchost.exe

4100 svchost.exe

4132 OneApp.IGCC.WinService.exe

4140 AnyDesk.exe

4148 armsvc.exe

4156 CxUtilSvc.exe

4208 WMIRegistrationService.exe

4284 msedge.exe

4312 svchost.exe

4320 AGMService.exe

4340 svchost.exe

4488 chrome.exe

4516 svchost.exe

4584 svchost.exe

4720 jhi_service.exe

4928 chrome.exe

5004 chrome.exe

5176 dwm.exe

5348 svchost.exe

5368 Flow.exe

5380 svchost.exe

5536 chrome.exe

5540 chrome.exe

5584 audiodg.exe

5620 svchost.exe

5724 svchost.exe

5776 svchost.exe

5992 ctfmon.exe

6032 CompPkgSrv.exe

6056 SearchProtocolHost.exe

6076 msedge.exe

6120 SearchIndexer.exe

6128 RuntimeBroker.exe

6156 svchost.exe

6192 MoUsoCoreWorker.exe

6380 PowerToys.PowerLauncher.exe

6424 PowerToys.Awake.exe

6480 msedge.exe

6596 svchost.exe

6740 svchost.exe

6792 winlogon.exe

6856 TrustedInstaller.exe

6872 svchost.exe

6888 igfxEM.exe

6908 svchost.exe

6948 chrome.exe

7140 csrss.exe

7296 PowerToys.KeyboardManagerEngine.exe

7336 WhatsApp.exe

7348 chrome.exe

7416 chrome.exe

7440 MusNotifyIcon.exe

7444 StartMenuExperienceHost.exe

7480 svchost.exe

7520 chrome.exe

7556 SearchApp.exe

7560 SecurityHealthService.exe

7720 msedge.exe

8220 MmReminderService.exe

8316 RuntimeBroker.exe

8636 svchost.exe

8836 python.exe

9088 ShellExperienceHost.exe

9284 svchost.exe

9344 NisSrv.exe

9560 msedge.exe

9664 chrome.exe

9736 chrome.exe

9784 SearchApp.exe

9808 svchost.exe

9868 python.exe

9884 svchost.exe

9908 chrome.exe

9936 chrome.exe

9996 QtWebEngineProcess.exe

10012 taskhostw.exe

10024 chrome.exe

10148 svchost.exe

10228 svchost.exe

10236 PowerToys.CropAndLock.exe

10304 Taskmgr.exe

10324 Video.UI.exe

10584 svchost.exe

10680 chrome.exe

10920 LockApp.exe

11064 chrome.exe

11176 chrome.exe

11188 msedge.exe

11396 msedge.exe

11500 QtWebEngineProcess.exe

11592 svchost.exe

12132 msedge.exe

12212 RuntimeBroker.exe

12360 RuntimeBroker.exe

12500 chrome.exe

12596 python.exe

12704 chrome.exe

12744 svchost.exe

12832 svchost.exe

12848 MicTray64.exe

12852 fontdrvhost.exe

12992 chrome.exe

13092 chrome.exe

13268 chrome.exe

13332 chrome.exe

13388 sihost.exe

13572 chrome.exe

13760 SecurityHealthSystray.exe

13792 msedge.exe

13880 fodhelper.exe

13900 chrome.exe

14160 UserOOBEBroker.exe

14220 RuntimeBroker.exe

14260 chrome.exe

14356 msedge.exe

14572 chrome.exe

14648 chrome.exe

14696 PowerToys.AlwaysOnTop.exe

14852 chrome.exe

14868 PowerToys.ColorPickerUI.exe

14876 conhost.exe

14888 PowerToys.PowerOCR.exe

14948 chrome.exe

15324 explorer.exe

4. Getting Process Information:

252

import psutil

# Get information for a specific process

pid = 252  # Replace with the process ID of interest

process = psutil.Process(pid)

print("Process Name:", process.name())

print("Process Status:", process.status())

print("Process CPU Percent:", process.cpu_percent(interval=1))

print("Process Memory Info:", process.memory_info())

#clcoding.com

Process Name: chrome.exe

Process Status: running

Process CPU Percent: 0.0

Process Memory Info: pmem(rss=29597696, vms=24637440, num_page_faults=14245, peak_wset=37335040, wset=29597696, peak_paged_pool=635560, paged_pool=635560, peak_nonpaged_pool=21344, nonpaged_pool=17536, pagefile=24637440, peak_pagefile=33103872, private=24637440)

5. Killing a Process:

import psutil

# Kill a process

pid_to_kill = 10088  

# Replace with the process ID to kill

process_to_kill = psutil.Process(pid_to_kill)

process_to_kill.terminate()

#clcoding.com

6. Getting Disk Usage:

import psutil

# Get disk usage information

disk_usage = psutil.disk_usage('/')

total_disk_space = disk_usage.total

used_disk_space = disk_usage.used

free_disk_space = disk_usage.free

disk_usage_percent = disk_usage.percent

print("Total Disk Space:", total_disk_space)

print("Used Disk Space:", used_disk_space)

print("Free Disk Space:", free_disk_space)

print("Disk Usage Percent:", disk_usage_percent)

#clcoding.com

Total Disk Space: 479491600384

Used Disk Space: 414899838976

Free Disk Space: 64591761408

Disk Usage Percent: 86.5

Tuesday, 12 March 2024

Python Coding challenge - Day 148 | What is the output of the following Python Code?


Let's break down the provided code:

d = {'Milk': 1, 'Soap': 2, 'Towel': 3}

if 'Soap' in d:

    print(d['Soap'])

d = {'Milk': 1, 'Soap': 2, 'Towel': 3}: This line initializes a dictionary named d with three key-value pairs. Each key represents an item, and its corresponding value represents the quantity of that item. In this case, there are items such as 'Milk', 'Soap', and 'Towel', each associated with a quantity.

if 'Soap' in d:: This line checks whether the key 'Soap' exists in the dictionary d. It does this by using the in keyword to check if the string 'Soap' is a key in the dictionary. If 'Soap' is present in the dictionary d, the condition evaluates to True, and the code inside the if block will execute.

print(d['Soap']): If the key 'Soap' exists in the dictionary d, this line will execute. It retrieves the value associated with the key 'Soap' from the dictionary d and prints it. In this case, the value associated with 'Soap' is 2, so it will print 2.

So, in summary, this code checks if the dictionary contains an entry for 'Soap'. If it does, it prints the quantity of soap available (which is 2 in this case).

Plots using Python


1. Line Plot:

#clcoding.com

import matplotlib.pyplot as plt

# Sample data

x = [1, 2, 3, 4, 5]

y = [2, 4, 6, 8, 10]

# Create a line plot

plt.plot(x, y)

plt.xlabel('X-axis')

plt.ylabel('Y-axis')

plt.title('Line Plot Example')

plt.show()

#clcoding.com


2. Bar Plot:

import matplotlib.pyplot as plt

# Sample data

categories = ['A', 'B', 'C', 'D']

values = [10, 20, 15, 25]

# Create a bar plot

plt.bar(categories, values)

plt.xlabel('Categories')

plt.ylabel('Values')

plt.title('Bar Plot Example')

plt.show()


3. Histogram:

import matplotlib.pyplot as plt

import numpy as np

# Generate random data

data = np.random.randn(1000)

# Create a histogram

plt.hist(data, bins=30)

plt.xlabel('Values')

plt.ylabel('Frequency')

plt.title('Histogram Example')

plt.show()


4. Scatter Plot:

import matplotlib.pyplot as plt

import numpy as np

# Generate random data

x = np.random.randn(100)

y = 2 * x + np.random.randn(100)

# Create a scatter plot

plt.scatter(x, y)

plt.xlabel('X-axis')

plt.ylabel('Y-axis')

plt.title('Scatter Plot Example')

plt.show()


5. Box Plot:

import seaborn as sns

import numpy as np

# Generate random data

data = np.random.randn(100)

# Create a box plot

sns.boxplot(data=data)

plt.title('Box Plot Example')

plt.show()


6. Violin Plot:

import seaborn as sns

import numpy as np

# Generate random data

data = np.random.randn(100)

# Create a violin plot

sns.violinplot(data=data)

plt.title('Violin Plot Example')

plt.show()


7. Heatmap:

#clcoding.com

import seaborn as sns

import numpy as np

# Generate random data

data = np.random.rand(10, 10)

#clcoding.com

# Create a heatmap

sns.heatmap(data)

plt.title('Heatmap Example')

plt.show()


8. Area Plot:

import matplotlib.pyplot as plt

# Sample data #clcoding.com

x = [1, 2, 3, 4, 5]

y1 = [2, 4, 6, 8, 10]

y2 = [1, 3, 5, 7, 9]

# Create an area plot

plt.fill_between(x, y1, color="skyblue", alpha=0.4)

plt.fill_between(x, y2, color="salmon", alpha=0.4)

plt.xlabel('X-axis')

plt.ylabel('Y-axis')

plt.title('Area Plot Example')

plt.show()


9. Pie Chart:

import matplotlib.pyplot as plt

# Sample data

sizes = [30, 20, 25, 15, 10]

labels = ['A', 'B', 'C', 'D', 'E']

# Create a pie chart

plt.pie(sizes, labels=labels, autopct='%1.1f%%', startangle=140)

plt.title('Pie Chart Example')

plt.show()


10. Polar Plot:

g

import matplotlib.pyplot as plt

import numpy as np

# Sample data

theta = np.linspace(0, 2*np.pi, 100)

r = np.sin(3*theta)

# Create a polar plot #clcoding.com

plt.polar(theta, r)

plt.title('Polar Plot Example')

plt.show()


11. 3D Plot:

import matplotlib.pyplot as plt

import numpy as np

# Sample data

x = np.linspace(-5, 5, 100)

y = np.linspace(-5, 5, 100)

X, Y = np.meshgrid(x, y)

Z = np.sin(np.sqrt(X**2 + Y**2))

# Create a 3D surface plot

fig = plt.figure()

ax = fig.add_subplot(111, projection='3d')

ax.plot_surface(X, Y, Z)

ax.set_title('3D Plot Example')

plt.show()


12. Violin Swarm Plot:

#clcoding.com

import seaborn as sns

import numpy as np

# Generate random data

data = np.random.randn(100)

#clcoding.com

# Create a violin swarm plot

sns.violinplot(data=data, inner=None, color='lightgray')

sns.swarmplot(data=data, color='blue', alpha=0.5)

plt.title('Violin Swarm Plot Example')

plt.show()


13. Pair Plot:

import seaborn as sns

import pandas as pd

# Load sample dataset

iris = sns.load_dataset('iris')

# Create a pair plot

sns.pairplot(iris)

plt.title('Pair Plot Example')

plt.show()


Monday, 11 March 2024

Python Coding challenge - Day 147 | What is the output of the following Python Code?


In Python, the is operator checks whether two variables reference the same object in memory, while the == operator checks for equality of values. Now, let's analyze the given code:

g = (1, 2, 3)

h = (1, 2, 3)

print(f"g is h: {g is h}")

print(f"g == h: {g == h}")

Explanation:

Identity (is):

The g is h expression checks if g and h refer to the same object in memory.

In this case, since tuples are immutable, Python creates separate objects for g and h with the same values (1, 2, 3).

Equality (==):


The g == h expression checks if the values contained in g and h are the same.

Tuples are compared element-wise. In this case, both tuples have the same elements (1, 2, 3).

Output:

The output of the code will be:

g is h: False

g == h: True

Explanation of Output:

g is h: False: The is operator returns False because g and h are distinct objects in memory.

g == h: True: The == operator returns True because the values inside g and h are the same.

In summary, the tuples g and h are different objects in memory, but they contain the same values, leading to == evaluating to True.

Cybersecurity using Python


1. Hashing Passwords:

import hashlib

def hash_password(password):

    hashed_password = hashlib.sha256(password.encode()).hexdigest()

    return hashed_password

# Example

password = "my_secure_password"

hashed_password = hash_password(password)

print("Hashed Password:", hashed_password)

#clcoding.com 

Hashed Password: 2c9a8d02fc17ae77e926d38fe83c3529d6638d1d636379503f0c6400e063445f

2. Generating Random Passwords:

import random

import string

def generate_random_password(length=12):

    characters = string.ascii_letters + string.digits + string.punctuation

    password = ''.join(random.choice(characters) for _ in range(length))

    return password

# Example

random_password = generate_random_password()

print("Random Password:", random_password)

#clcoding.com 

Random Password: zH7~ANoO:7#S

3. Network Scanning with Scapy:

from scapy.all import IP, ICMP, sr1

def ping(host):

    packet = IP(dst=host)/ICMP()

    response = sr1(packet, timeout=2, verbose=0)

    if response:

        return f"{host} is online"

    else:

        return f"{host} is offline"

# Example

host_to_scan = "example.com"

result = ping(host_to_scan)

print(result)

#clcoding.com

4. Web Scraping for Security Research:

import requests

from bs4 import BeautifulSoup

def scrape_security_news():

    url = "https://example-security-news.com"

    response = requests.get(url)

    soup = BeautifulSoup(response.text, 'html.parser')

    headlines = soup.find_all('h2', class_='security-headline')

    return [headline.text for headline in headlines]

# Example

security_headlines = scrape_security_news()

print("Security Headlines:", security_headlines)

#clcoding.com

5. Password Cracking Simulation:

import hashlib

def simulate_password_cracking(hashed_password, password_list):

    for password in password_list:

        if hashlib.sha256(password.encode()).hexdigest() == hashed_password:

            return f"Password cracked: {password}"

    return "Password not found"

# Example

hashed_password_to_crack = "d033e22ae348aeb5660fc2140aec35850c4da997"

common_passwords = ["password", "123456", "qwerty", "admin"]

result = simulate_password_cracking(hashed_password_to_crack, common_passwords)

print(result)

#clcoding.com

6. Secure File Handling:

import os

def secure_file_deletion(file_path):

    with open(file_path, 'w') as file:

        file.write(os.urandom(1024))  

        # Overwrite the file with random data

    os.remove(file_path)

    print(f"{file_path} securely deleted")

# Example

file_path_to_delete = "example.txt"

secure_file_deletion(file_path_to_delete)

#clcoding.com


Sunday, 10 March 2024

Python Coding challenge - Day 146 | What is the output of the following Python Code?


Let's go through the code step by step:

years = 5: Initializes a variable named years with the value 5.

if True or False:: This is an if statement with a condition. The condition is True or False, which will always be True because the logical OR (or) operator returns True if at least one of the operands is True. In this case, True is always True, so the condition is satisfied.

years = years + 2: Inside the if block, there's an assignment statement that adds 2 to the current value of the years variable. Since the condition is always True, this line of code will always be executed.

print(years): Finally, this line prints the current value of the years variable.

As a result, the code will always enter the if block, increment the value of years by 2 (from 5 to 7), and then print the final value of years, which is 7.

Saturday, 9 March 2024

try and except in Python


Example 1: Handling a Specific Exception

try:

    # Code that might raise an exception

    num = int(input("Enter a number: "))

    result = 10 / num

    print("Result:", result)

except ZeroDivisionError:

    # Handle the specific exception (division by zero)

    print("Error: Cannot divide by zero.")

except ValueError:

    # Handle the specific exception (invalid input for conversion to int)

    print("Error: Please enter a valid number.")


#clcoding.com

Enter a number: 5

Result: 2.0

Example 2: Handling Multiple Exceptions

try:

    file_name = input("Enter the name of a file: ")


    # Open and read the contents of the file

    with open(file_name, 'r') as file:

        contents = file.read()

        print("File contents:", contents)

except FileNotFoundError:

    # Handle the specific exception (file not found)

    print("Error: File not found.")

except PermissionError:

    # Handle the specific exception (permission error)

    print("Error: Permission denied to access the file.")


except Exception as e:

    # Handle any other exceptions not explicitly caught

    print(f"An unexpected error occurred: {e}")

    #clcoding.com

Enter the name of a file: clcoding

Error: File not found.

Example 3: Using a Generic Exception

try:

    # Code that might raise an exception

    x = int(input("Enter a number: "))

    y = 10 / x

    print("Result:", y)

except Exception as e:

    # Catch any type of exception

    print(f"An error occurred: {e}")


 #clcoding.com

Enter a number: 5

Result: 2.0

Python Coding challenge - Day 145 | What is the output of the following Python Code?


Let's evaluate the provided Python code:

a = 20 or 40

if 30 <= a <= 50:

    print('Hello')

else:

    print('Hi')

Here's a step-by-step breakdown:

Assignment of a:

a = 20 or 40: In Python, the or operator returns the first true operand or the last operand if none are true. In this case, 20 is considered true, so a is assigned the value 20.

Condition Check:

if 30 <= a <= 50:: Checks whether the value of a falls within the range from 30 to 50 (inclusive).

Print Statement Execution:

Since a is assigned the value 20, which is outside the range 30 to 50, the condition is not met.

Therefore, the else block is executed, and the output will be Hi.

Let's run through the logic:

Is 30 <= 20 <= 50? No.

So, the else block is executed, and 'Hi' is printed.

The output of this code will be:

Hi

Friday, 8 March 2024

Lambda Functions in Python


Example 1: Basic Syntax

# Regular function

def add(x, y):

    return x + y

# Equivalent lambda function

lambda_add = lambda x, y: x + y

# Using both functions

result_regular = add(3, 5)

result_lambda = lambda_add(3, 5)

print("Result (Regular Function):", result_regular)

print("Result (Lambda Function):", result_lambda)

#clcoding.com

Result (Regular Function): 8

Result (Lambda Function): 8

Example 2: Sorting with Lambda

# List of tuples

students = [("Alice", 25), ("Bob", 30), ("Charlie", 22)]

# Sort by age using a lambda function

sorted_students = sorted(students, key=lambda student: student[1])

print("Sorted Students by Age:", sorted_students)

#clcoding.com

Sorted Students by Age: [('Charlie', 22), ('Alice', 25), ('Bob', 30)]

Example 3: Filtering with Lambda

# List of numbers

numbers = [1, 2, 3, 4, 5, 6, 7, 8, 9]

# Filter even numbers using a lambda function

even_numbers = list(filter(lambda x: x % 2 == 0, numbers))

print("Even Numbers:", even_numbers)

#clcoding.com

Even Numbers: [2, 4, 6, 8]

Example 4: Mapping with Lambda

# List of numbers

numbers = [1, 2, 3, 4, 5]

# Square each number using a lambda function

squared_numbers = list(map(lambda x: x**2, numbers))

print("Squared Numbers:", squared_numbers)

#clcoding.com

Squared Numbers: [1, 4, 9, 16, 25]

Example 5: Using Lambda with max function

# List of numbers

numbers = [10, 5, 8, 20, 15]

# Find the maximum number using a lambda function

max_number = max(numbers, key=lambda x: -x)  # Use negation for finding the minimum

print("Maximum Number:", max_number)

#clcoding.com

Maximum Number: 5

Example 6: Using Lambda with sorted and Multiple Criteria

# List of dictionaries representing people with names and ages

people = [{"name": "Alice", "age": 25}, {"name": "Bob", "age": 30}, {"name": "Charlie", "age": 22}]

# Sort by age and then by name using a lambda function

sorted_people = sorted(people, key=lambda person: (person["age"], person["name"]))

print("Sorted People:", sorted_people)

#clcoding.com

Sorted People: [{'name': 'Charlie', 'age': 22}, {'name': 'Alice', 'age': 25}, {'name': 'Bob', 'age': 30}]

Example 7: Using Lambda with reduce from functools

from functools import reduce

# List of numbers

numbers = [1, 2, 3, 4, 5]

# Calculate the product of all numbers using a lambda function and reduce

product = reduce(lambda x, y: x * y, numbers)

print("Product of Numbers:", product)

#clcoding.com

Product of Numbers: 120

Example 8: Using Lambda with Conditional Expressions

# List of numbers

numbers = [10, 5, 8, 20, 15]

# Use a lambda function with a conditional expression to filter and square even numbers

filtered_and_squared = list(map(lambda x: x**2 if x % 2 == 0 else x, numbers))

print("Filtered and Squared Numbers:", filtered_and_squared)

#clcoding.com

Filtered and Squared Numbers: [100, 5, 64, 400, 15]

Example 9: Using Lambda with key in max and min to Find Extremes

# List of tuples representing products with names and prices

products = [("Laptop", 1200), ("Phone", 800), ("Tablet", 500), ("Smartwatch", 200)]

# Find the most and least expensive products using lambda functions

most_expensive = max(products, key=lambda item: item[1])

least_expensive = min(products, key=lambda item: item[1])

print("Most Expensive Product:", most_expensive)

print("Least Expensive Product:", least_expensive)

#clcoding.com

Most Expensive Product: ('Laptop', 1200)

Least Expensive Product: ('Smartwatch', 200)

Python Coding challenge - Day 144 | What is the output of the following Python Code?


The code print(()*3) in Python will print an empty tuple three times.

Let's break down the code:

print(): This is a built-in function in Python used to output messages to the console.

(): This represents an empty tuple. A tuple is an ordered collection of items similar to a list, but unlike lists, tuples are immutable, meaning their elements cannot be changed after creation.

*3: This is the unpacking operator. In this context, it unpacks the empty tuple three times.

Since an empty tuple by itself doesn't contain any elements to print, it essentially prints nothing three times. So the output of this code will be an empty line repeated three times.

Fractal Data Science Professional Certificate


What you'll learn

 Apply structured problem-solving techniques to dissect and address complex data-related challenges encountered in real-world scenarios.   

Utilize SQL proficiency to retrieve, manipulate data and employ data visualization skills using Power BI to communicate insights.

Apply Python expertise for data manipulation, analysis and implement machine learning algorithms to create predictive models for applications.

Create compelling data stories to influence your audience and master the art of critically analyzing data while making decisions and recommendations.

Join Free: Fractal Data Science Professional Certificate

Professional Certificate - 8 course series

Data science is projected to create 11.5 1 million global job openings by 2026 and offers many of the remote 2 job opportunities in the industry.

Prepare for a new career in this high-demand field with a Professional Certificate from Fractal Analytics. Whether you're a recent graduate seeking a rewarding career shift or a professional aiming to upskill, this program will equip you with the essential skills demanded by the industry.

This curriculum is designed with a problem-solving approach at the center to equip and enable you with the skills, required to solve data science problems, instead of just focusing on the tools and applications.

Through hands-on courses you'll master Python programming, harness the power of machine learning, cultivate expertise in data manipulation, and build understanding of cognitive factors affecting decisions. You will also learn the direct application of tools like SQL, PowerBI, and Python to real-world scenarios.

Upon completion, you will earn a Professional Certificate, which will help to make your profile standout in your career journey.

Fractal Data Science Professional Certificate is one of the preferred qualifications for entry-level data science jobs at Fractal. Complete this certificate to make your profile standout from other candidates while applying for job openings at Fractal.

Applied Learning Project

Learners will be able to apply structured problem-solving techniques to dissect and address complex data-related challenges encountered in real-world scenarios and utilize SQL proficiency to retrieve and manipulate data and employ data visualization skills using Power BI to communicate insights. Becoming experts at Python programming to manipulate and analyze data. Learners will implement machine learning algorithms to create predictive models for diverse applications. And create compelling data stories to influence and inform your audience and master the art of critically analyzing data while making decisions and recommendations.

CertNexus Certified Data Science Practitioner Professional Certificate


Advance your career with in-demand skills

Receive professional-level training from CertNexus

Demonstrate your technical proficiency

Earn an employer-recognized certificate from CertNexus

Prepare for an industry certification exam

Join Free: CertNexus Certified Data Science Practitioner Professional Certificate

Professional Certificate - 5 course series

The field of Data Science has topped the Linked In Emerging Jobs list for the last 3 years with a projected growth of 28% annually and the World Economic Forum lists Data Analytics and Scientists as the top emerging job for 2022. 

Data can reveal insights and inform business—by guiding decisions and influencing day-to-day operations. This specialization will teach learners how to analyze, understand, manipulate, and present data within an effective and repeatable process framework and will enable you to bring value to the business by putting data science concepts into practice. 

This course is designed for business professionals that want to learn how to more effectively extract insights from their work and leverage that insight in addressing business issues, thereby bringing greater value to the business. The typical student in this course will have several years of experience with computing technology, including some aptitude in computer programming.

Certified Data Science Practitioner (CDSP)  will prepare learners for the CertNexus CDSP certification exam. 

To complete your journey to the CDSP Certification

Complete the Coursera Certified Data Science Practitioner Professional Certificate.

Review the CDSP Exam Blueprint
.

Purchase your CDSP Exam Voucher

Register for your CDSP Exam.

Applied Learning Project

At the conclusion of each course, learners will have the opportunity to complete a project which can be added to their portfolio of work.  Projects include: 

Address a Business Issue with Data Science 

Extract, Transform, and Load Data

Data Analysis

Training a Machine Learning Model

Presenting a Data Science Project

IBM Data Engineering Professional Certificate


What you'll learn

Master the most up-to-date practical skills and knowledge data engineers use in their daily roles

Learn to create, design, & manage relational databases & apply database administration (DBA) concepts to RDBMSs such as MySQL, PostgreSQL, & IBM Db2 

Develop working knowledge of NoSQL & Big Data using MongoDB, Cassandra, Cloudant, Hadoop, Apache Spark, Spark SQL, Spark ML, and Spark Streaming 

Implement ETL & Data Pipelines with Bash, Airflow & Kafka; architect, populate, deploy Data Warehouses; create BI reports & interactive dashboards 

Join Free: IBM Data Engineering Professional Certificate

Professional Certificate - 13 course series

Prepare for a career in the high-growth field of data engineering. In this program, you’ll learn in-demand skills like Python, SQL, and Databases to get job-ready in less than 5 months.

Data engineering is building systems to gather data, process and organize raw data into usable information, and manage data. The work data engineers do provides the foundational information that data scientists and business intelligence (BI) analysts use to make recommendations and decisions.

This program will teach you the foundational data engineering skills employers are seeking for entry level data engineering roles, including Python, one of the most widely used programming languages. You’ll also master SQL, RDBMS, ETL, Data Warehousing, NoSQL, Big Data, and Spark with hands-on labs and projects.

You’ll learn to use Python programming language and Linux/UNIX shell scripts to extract, transform and load (ETL) data. You’ll also work with Relational Databases (RDBMS) and query data using SQL statements and use NoSQL databases as well as unstructured data. 

When you complete the full program, you’ll have a portfolio of projects and a Professional Certificate from IBM to showcase your expertise. You’ll also earn an IBM Digital badge and will gain access to career resources to help you in your job search, including mock interviews and resume support. 

This program is ACE® recommended—when you complete, you can earn up to 12 college credits.

Applied Learning Project

Throughout this Professional Certificate, you will complete hands-on labs and projects to help you gain practical experience with Python, SQL, relational databases, NoSQL databases, Apache Spark, building data pipelines, managing databases, and working with data warehouses.

Design a relational database to help a coffee franchise improve operations.

Use SQL to query census, crime, and school demographic data sets.

Write a Bash shell script on Linux that backups changed files.

Set up, test, and optimize a data platform that contains MySQL, PostgreSQL, and IBM Db2 databases.

Analyze road traffic data to perform ETL and create a pipeline using Airflow and Kafka.

Design and implement a data warehouse for a solid-waste management company.

Move, query, and analyze data in MongoDB, Cassandra, and Cloudant NoSQL databases.

Train a machine learning model by creating an Apache Spark application.

This program is FIBAA recommended—when you complete, you can earn up to 8 ECTS credits.

Preparing for Google Cloud Certification: Cloud Data Engineer Professional Certificate


What you'll learn

Identify the purpose and value of the key Big Data and Machine Learning products in Google Cloud.

Employ BigQuery to carry out interactive data analysis.

Use Cloud SQL and Dataproc to migrate existing MySQL and Hadoop/Pig/Spark/Hive workloads to Google Cloud.

Choose between different data processing products on Google Cloud.

Join Free: Preparing for Google Cloud Certification: Cloud Data Engineer Professional Certificate 

Professional Certificate - 6 course series

Google Cloud Professional Data Engineer certification was ranked #1 
on Global Knowledge's list of 15 top-paying certifications in 2021
! Enroll now to prepare!

---

87% of Google Cloud certified users feel more confident in their cloud skills. This program provides the skills you need to advance your career and provides training to support your preparation for the industry-recognized
 Google Cloud Professional Data Engineer
 certification.

Here's what you have to do

1) Complete the Coursera Data Engineering Professional Certificate

2) Review other recommended resources for the Google Cloud Professional Data Engineer certification
 exam

3) Review the Professional Data Engineer exam guide

4) Complete Professional Data Engineer sample questions

5)Register for the Google Cloud certification exam (remotely or at a test center)

Applied Learning Project

This professional certificate incorporates hands-on labs using Qwiklabs platform.These hands on components will let you apply the skills you learn. Projects incorporate Google Cloud Platform products used within Qwiklabs. You will gain practical hands-on experience with the concepts explained throughout the modules.

Applied Learning Project

 This Professional Certificate incorporates hands-on labs using our Qwiklabs platform.

These hands on components will let you apply the skills you learn in the video lectures. Projects will incorporate topics such as Google BigQuery, which are used and configured within Qwiklabs. You can expect to gain practical hands-on experience with the concepts explained throughout the modules.

Tableau Business Intelligence Analyst Professional Certificate


What you'll learn

Gain the essential skills necessary to excel in an entry-level Business Intelligence Analytics role.

Learn to use Tableau Public to manipulate and prepare data for analysis.

Craft and dissect data visualizations that reveal patterns and drive actionable insights.

Construct captivating narratives through data, enabling stakeholders to explore insights effectively.

Join Free: Tableau Business Intelligence Analyst Professional Certificate

Professional Certificate - 8 course series

Whether you are just starting out or looking for a career change, the Tableau Business Intelligence Analytics Professional Certificate will prepare you for entry-level roles that require fundamental Tableau skills, such as business intelligence analyst roles. If you are detail-oriented and have an interest in looking for trends in data, this program is for you. Through hands-on, real-world scenarios, you learn how to use the Tableau platform to evaluate data to generate and present actionable business insights. Upon completion, you will be prepared to take the 
Tableau Desktop Specialist Exam
.  With this certification, you will be qualified to apply for a position in the business intelligence analyst field.  

In this program, you’ll: 

 Craft problem statements, business requirement documents, and visual models.

 Connect with various data sources and preprocess data in Tableau for enhanced quality and analysis.

 Learn to utilize the benefits of Tableau’s analytics features for efficient reporting.

Learn to create advanced and spatial analytics data visualizations by integrating motion and multi-layer elements to effectively communicate insights to stakeholders.

Employ data storytelling principles and design techniques to craft compelling presentations that empower you to extract meaningful insights.

This program was developed by Tableau experts, designed to prepare you for a career in Business Intelligence Analytics and help you learn the most relevant skills.

Applied Learning Project

 Throughout the program, you’ll engage in applied learning through hands-on activities to help level up your knowledge. Each course contains ungraded quizzes throughout the content, a graded quiz at the end of each module, and a variety of hands-on projects. The program activities will give you the skills to : 

Preprocess, manage, and manipulate data for analysis using Tableau. 

Create and customize Visualizations in Tableau. 

Learn best practices for creating presentations to communicate data analysis insights to stakeholders. 

Thursday, 7 March 2024

Interpretable Machine Learning with Python - Second Edition: Build explainable, fair, and robust high-performance models with hands-on, real-world examples


A deep dive into the key aspects and challenges of machine learning interpretability using a comprehensive toolkit, including SHAP, feature importance, and causal inference, to build fairer, safer, and more reliable models.

Purchase of the print or Kindle book includes a free eBook in PDF format.

Key Features

Interpret real-world data, including cardiovascular disease data and the COMPAS recidivism scores

Build your interpretability toolkit with global, local, model-agnostic, and model-specific methods

Analyze and extract insights from complex models from CNNs to BERT to time series models

Book Description

Interpretable Machine Learning with Python, Second Edition, brings to light the key concepts of interpreting machine learning models by analyzing real-world data, providing you with a wide range of skills and tools to decipher the results of even the most complex models.

Build your interpretability toolkit with several use cases, from flight delay prediction to waste classification to COMPAS risk assessment scores. This book is full of useful techniques, introducing them to the right use case. Learn traditional methods, such as feature importance and partial dependence plots to integrated gradients for NLP interpretations and gradient-based attribution methods, such as saliency maps.

In addition to the step-by-step code, you'll get hands-on with tuning models and training data for interpretability by reducing complexity, mitigating bias, placing guardrails, and enhancing reliability.

By the end of the book, you'll be confident in tackling interpretability challenges with black-box models using tabular, language, image, and time series data.

What you will learn

Progress from basic to advanced techniques, such as causal inference and quantifying uncertainty

Build your skillset from analyzing linear and logistic models to complex ones, such as CatBoost, CNNs, and NLP transformers

Use monotonic and interaction constraints to make fairer and safer models

Understand how to mitigate the influence of bias in datasets

Leverage sensitivity analysis factor prioritization and factor fixing for any model

Discover how to make models more reliable with adversarial robustness

Who this book is for

This book is for data scientists, machine learning developers, machine learning engineers, MLOps engineers, and data stewards who have an increasingly critical responsibility to explain how the artificial intelligence systems they develop work, their impact on decision making, and how they identify and manage bias. It's also a useful resource for self-taught ML enthusiasts and beginners who want to go deeper into the subject matter, though a good grasp of the Python programming language is needed to implement the examples.

Table of Contents

Interpretation, Interpretability and Explainability; and why does it all matter?

Key Concepts of Interpretability

Interpretation Challenges

Global Model-agnostic Interpretation Methods

Local Model-agnostic Interpretation Methods

Anchors and Counterfactual Explanations

Visualizing Convolutional Neural Networks

Interpreting NLP Transformers

Interpretation Methods for Multivariate Forecasting and Sensitivity Analysis

Feature Selection and Engineering for Interpretability

Bias Mitigation and Causal Inference Methods

Monotonic Constraints and Model Tuning for Interpretability

Adversarial Robustness

What's Next for Machine Learning Interpretability?

Hard Copy: Interpretable Machine Learning with Python - Second Edition: Build explainable, fair, and robust high-performance models with hands-on, real-world examples

Generative AI with LangChain: Build large language model (LLM) apps with Python, ChatGPT and other LLMs


Get to grips with the LangChain framework from theory to deployment and develop production-ready applications.

Code examples regularly updated on GitHub to keep you abreast of the latest LangChain developments.

Purchase of the print or Kindle book includes a free PDF eBook.

Key Features

Learn how to leverage LLMs' capabilities and work around their inherent weaknesses

Delve into the realm of LLMs with LangChain and go on an in-depth exploration of their fundamentals, ethical dimensions, and application challenges

Get better at using ChatGPT and GPT models, from heuristics and training to scalable deployment, empowering you to transform ideas into reality

Book Description

ChatGPT and the GPT models by OpenAI have brought about a revolution not only in how we write and research but also in how we can process information. This book discusses the functioning, capabilities, and limitations of LLMs underlying chat systems, including ChatGPT and Bard. It also demonstrates, in a series of practical examples, how to use the LangChain framework to build production-ready and responsive LLM applications for tasks ranging from customer support to software development assistance and data analysis - illustrating the expansive utility of LLMs in real-world applications.

Unlock the full potential of LLMs within your projects as you navigate through guidance on fine-tuning, prompt engineering, and best practices for deployment and monitoring in production environments. Whether you're building creative writing tools, developing sophisticated chatbots, or crafting cutting-edge software development aids, this book will be your roadmap to mastering the transformative power of generative AI with confidence and creativity.

What you will learn

Understand LLMs, their strengths and limitations

Grasp generative AI fundamentals and industry trends

Create LLM apps with LangChain like question-answering systems and chatbots

Understand transformer models and attention mechanisms

Automate data analysis and visualization using pandas and Python

Grasp prompt engineering to improve performance

Fine-tune LLMs and get to know the tools to unleash their power

Deploy LLMs as a service with LangChain and apply evaluation strategies

Privately interact with documents using open-source LLMs to prevent data leaks

Who this book is for

The book is for developers, researchers, and anyone interested in learning more about LLMs. Whether you are a beginner or an experienced developer, this book will serve as a valuable resource if you want to get the most out of LLMs and are looking to stay ahead of the curve in the LLMs and LangChain arena.

Basic knowledge of Python is a prerequisite, while some prior exposure to machine learning will help you follow along more easily.

Table of Contents

What Is Generative AI?

LangChain for LLM Apps

Getting Started with LangChain

Building Capable Assistants

Building a Chatbot like ChatGPT

Developing Software with Generative AI

LLMs for Data Science

Customizing LLMs and Their Output

Generative AI in Production

The Future of Generative Models

Hard Copy: Generative AI with LangChain: Build large language model (LLM) apps with Python, ChatGPT and other LLMs

Developing Kaggle Notebooks: Pave your way to becoming a Kaggle Notebooks Grandmaster


Printed in Color

Develop an array of effective strategies and blueprints to approach any new data analysis on the Kaggle platform and create Notebooks with substance, style and impact

Leverage the power of Generative AI with Kaggle Models

Purchase of the print or Kindle book includes a free PDF eBook

Key Features

Master the basics of data ingestion, cleaning, exploration, and prepare to build baseline models

Work robustly with any type, modality, and size of data, be it tabular, text, image, video, or sound

Improve the style and readability of your Notebooks, making them more impactful and compelling

Book Description

Developing Kaggle Notebooks introduces you to data analysis, with a focus on using Kaggle Notebooks to simultaneously achieve mastery in this fi eld and rise to the top of the Kaggle Notebooks tier. The book is structured as a sevenstep data analysis journey, exploring the features available in Kaggle Notebooks alongside various data analysis techniques.

For each topic, we provide one or more notebooks, developing reusable analysis components through Kaggle's Utility Scripts feature, introduced progressively, initially as part of a notebook, and later extracted for use across future notebooks to enhance code reusability on Kaggle. It aims to make the notebooks' code more structured, easy to maintain, and readable.

Although the focus of this book is on data analytics, some examples will guide you in preparing a complete machine learning pipeline using Kaggle Notebooks. Starting from initial data ingestion and data quality assessment, you'll move on to preliminary data analysis, advanced data exploration, feature qualifi cation to build a model baseline, and feature engineering. You'll also delve into hyperparameter tuning to iteratively refi ne your model and prepare for submission in Kaggle competitions. Additionally, the book touches on developing notebooks that leverage the power of generative AI using Kaggle Models.

What you will learn

Approach a dataset or competition to perform data analysis via a notebook

Learn data ingestion and address issues arising with the ingested data

Structure your code using reusable components

Analyze in depth both small and large datasets of various types

Distinguish yourself from the crowd with the content of your analysis

Enhance your notebook style with a color scheme and other visual effects

Captivate your audience with data and compelling storytelling techniques

Who this book is for

This book is suitable for a wide audience with a keen interest in data science and machine learning, looking to use Kaggle Notebooks to improve their skills and rise in the Kaggle Notebooks ranks. This book caters to:

Beginners on Kaggle from any background

Seasoned contributors who want to build various skills like ingestion, preparation, exploration, and visualization

Expert contributors who want to learn from the Grandmasters to rise into the upper Kaggle rankings

Professionals who already use Kaggle for learning and competing

Table of Contents

Introducing Kaggle and Its Basic Functions

Getting Ready for Your Kaggle Environment

Starting Our Travel - Surviving the Titanic Disaster

Take a Break and Have a Beer or Coffee in London

Get Back to Work and Optimize Microloans for Developing Countries

Can You Predict Bee Subspecies?

Text Analysis Is All You Need

Analyzing Acoustic Signals to Predict the Next Simulated Earthquake

Can You Find Out Which Movie Is a Deepfake?

Unleash the Power of Generative AI with Kaggle Models

Closing Our Journey: How to Stay Relevant and on Top

Hard Copy: Developing Kaggle Notebooks: Pave your way to becoming a Kaggle Notebooks Grandmaster


Wednesday, 6 March 2024

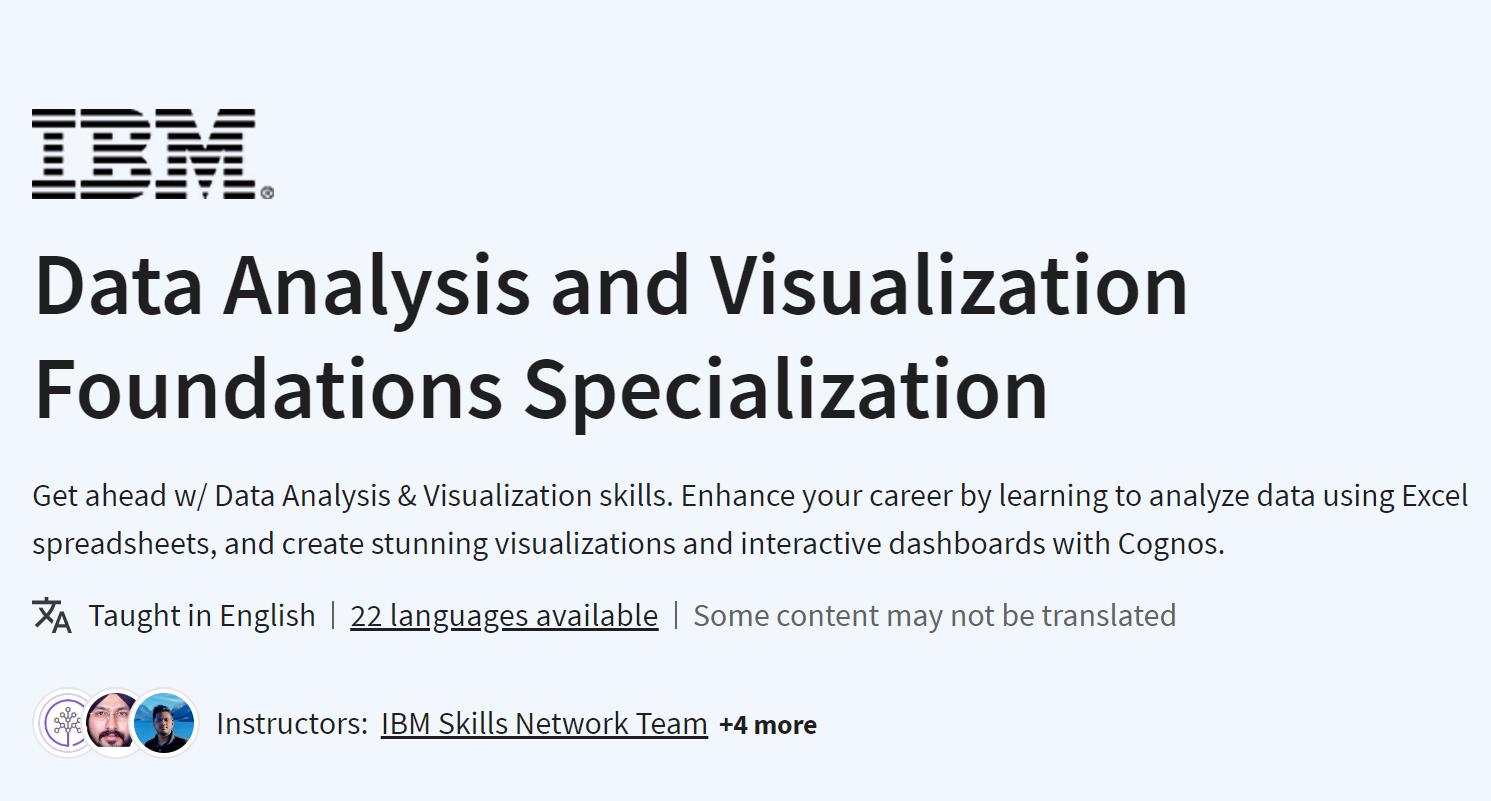
Data Analysis and Visualization Foundations Specialization


What you'll learn

Describe the data ecosystem, tasks a Data Analyst performs, as well as skills and tools required for successful data analysis

Explain basic functionality of spreadsheets and utilize Excel to perform a variety of data analysis tasks like data wrangling and data mining

List various types of charts and plots and create them in Excel as well as work with Cognos Analytics to generate interactive dashboards

Join Free: Data Analysis and Visualization Foundations Specialization

Specialization - 4 course series

Deriving insights from data and communicating findings has become an increasingly important part of virtually every profession. This Specialization prepares you for this data-driven transformation by teaching you the core principles of data analysis and visualization and by giving you the tools and hands-on practice to communicate the results of your data discoveries effectively.  

You will be introduced to the modern data ecosystem. You will learn the skills required to successfully start data analysis tasks by becoming familiar with spreadsheets like Excel. You will examine different data sets, load them into the spreadsheet, and employ techniques like summarization, sorting, filtering, & creating pivot tables.

Creating stunning visualizations is a critical part of communicating your data analysis results. You will use Excel spreadsheets to create the many different types of data visualizations such as line plots, bar charts, pie charts. You will also create advanced visualizations such as treemaps, scatter charts & map charts. You will then build interactive dashboards. 

This Specialization is designed for learners interested in starting a career in the field of Data or Business Analytics, as well as those in other professions, who need basic data analysis and visualization skills to supplement their primary job tasks.

This program is ACE® recommended—when you complete, you can earn up to 9 college credits.  

Applied Learning Project

Build your data analytics portfolio as you gain practical experience from producing artifacts in the interactive labs and projects throughout this program. Each course has a culminating project to apply your newfound skills:

In the first course, create visualizations to detect fraud by analyzing credit card data.

In the second course, import, clean, and analyze fleet vehicle inventory with Excel pivot tables.

In the third course, use car sales key performance indicator (KPI) data to create an interactive dashboard with stunning visualizations using Excel and IBM Cognos Analytics.

Only a modern web browser is required to complete these practical exercises and projects — no need to download or install anything on your device.

IBM AI Foundations for Business Specialization


Advance your subject-matter expertise

Learn in-demand skills from university and industry experts

Master a subject or tool with hands-on projects

Develop a deep understanding of key concepts

Earn a career certificate from IBM

Join Free: IBM AI Foundations for Business Specialization

Specialization - 3 course series

This specialization will explain and describe the overall focus areas for business leaders considering AI-based solutions for business challenges. The first course provides a business-oriented summary of technologies and basic concepts in AI. The second will introduce the technologies and concepts in data science. The third introduces the AI Ladder, which is a framework for understanding the work and processes that are necessary for the successful deployment of AI-based solutions.  

Applied Learning Project

Each of the courses in this specialization include Checks for Understanding, which are designed to assess each learner’s ability to understand the concepts presented as well as use those concepts in actual practice.  Specifically, those concepts are related to introductory knowledge regarding 1) artificial intelligence; 2) data science, and; 3) the AI Ladder.  

IBM & Darden Digital Strategy Specialization


What you'll learn

Understand the value of data and how the rapid growth of technologies such as artificial intelligence and cloud computing are transforming business. 

Join Free: IBM & Darden Digital Strategy Specialization

Specialization - 6 course series

This Specialization was designed to combine the most current business research in digital transformation and strategy with the most up-to-date technical knowledge of the technologies that are changing how we work and do business to enable you to advance your career. By the end of this Specialization, you will have an understanding of the three technologies impacting all businesses: artificial intelligence, cloud computing, and data science. You will also be able to develop or advance a digital transformation strategy for your own business using these technologies. This specialization will help managers understand technology and technical workers to understand strategy, and is ideal for anyone who wants to be able to help lead projects in digital transformation and technical and business strategy.

Applied Learning Project

This Specialization was designed to combine the most current business research in digital transformation and strategy with the most up-to-date technical knowledge of the technologies that are changing how we work and do business to enable you to advance your career. By the end of this Specialization, you will have an understanding of the three technologies impacting all businesses: artificial intelligence, cloud computing, and data science. You will also be able to develop or advance a digital transformation strategy for your own business using these technologies. This specialization will help managers understand technology and technical workers to understand strategy, and is ideal for anyone who wants to be able to help lead projects in digital transformation and technical and business strategy.

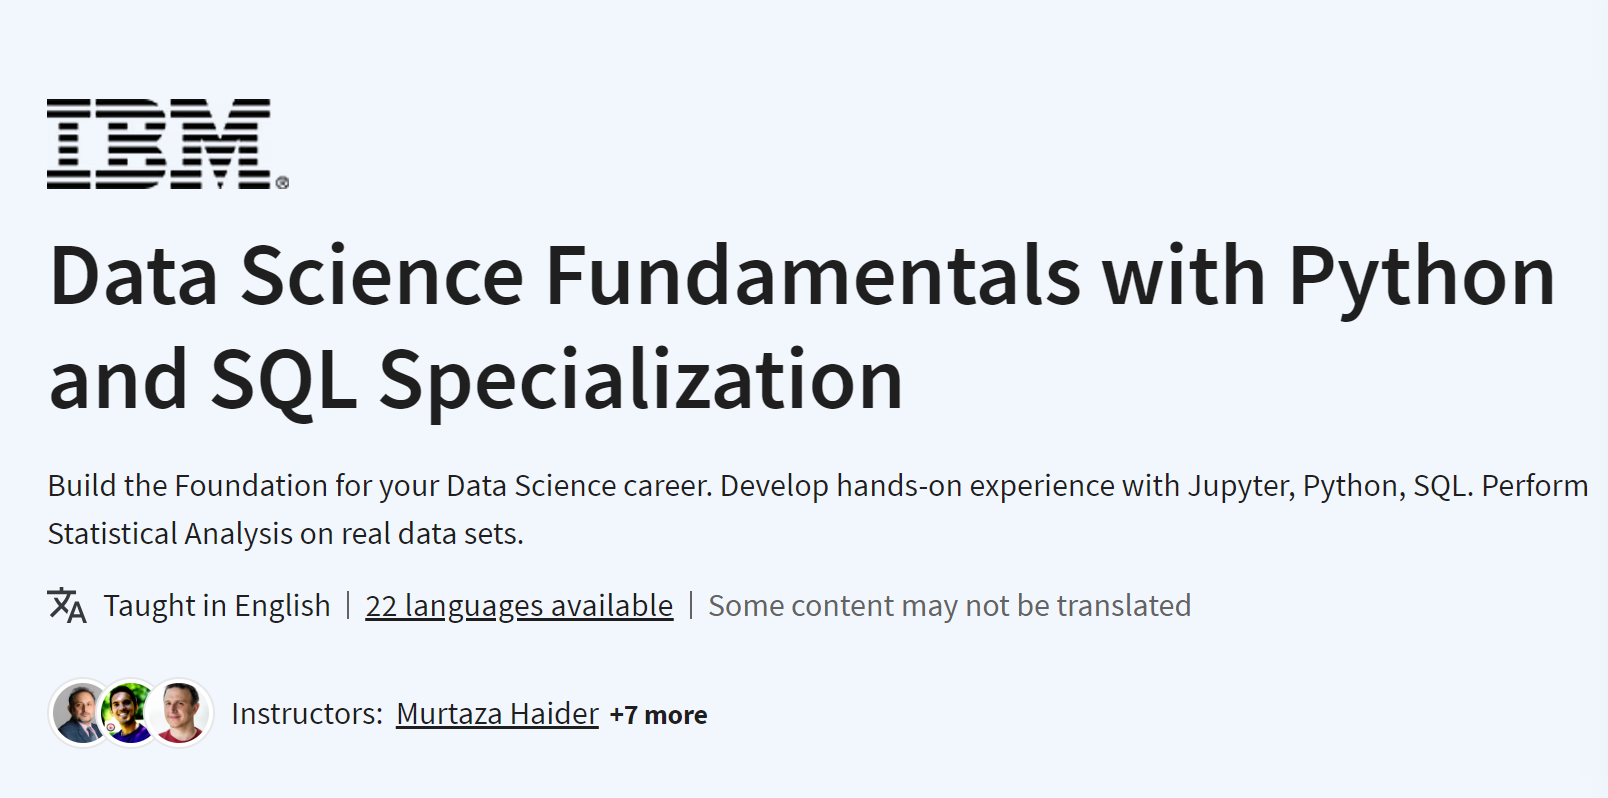
Data Science Fundamentals with Python and SQL Specialization


What you'll learn

Working knowledge of Data Science Tools such as Jupyter Notebooks, R Studio, GitHub, Watson Studio

Python programming basics including data structures, logic, working with files, invoking APIs, and libraries such as Pandas and Numpy

Statistical Analysis techniques including  Descriptive Statistics, Data Visualization, Probability Distribution, Hypothesis Testing and Regression

Relational Database fundamentals including SQL query language, Select statements, sorting & filtering, database functions, accessing multiple tables

Join Free: Data Science Fundamentals with Python and SQL Specialization

Specialization - 5 course series

Data Science is one of the hottest professions of the decade, and the demand for data scientists who can analyze data and communicate results to inform data driven decisions has never been greater. This Specialization from IBM will help anyone interested in pursuing a career in data science by teaching them fundamental skills to get started in this in-demand field.

The specialization consists of 5 self-paced online courses that will provide you with the foundational skills required for Data Science, including open source tools and libraries, Python, Statistical Analysis, SQL, and relational databases. You’ll learn these data science pre-requisites through hands-on practice using real data science tools and real-world data sets.

Upon successfully completing these courses, you will have the practical knowledge and experience to delve deeper in Data Science and work on more advanced Data Science projects. 

No prior knowledge of computer science or programming languages required. 

This program is ACE® recommended—when you complete, you can earn up to 8 college credits.  

Applied Learning Project

All courses in the specialization contain multiple hands-on labs and assignments to help you gain practical experience and skills with a variety of data sets. Build your data science portfolio from the artifacts you produce throughout this program. Course-culminating projects include:

Extracting and graphing financial data with the Pandas data analysis Python library

Generating visualizations and conducting statistical tests to provide insight on housing trends using census data

Using SQL to query census, crime, and demographic data sets to identify causes that impact enrollment, safety, health, and environment ratings in schools

Introduction to Data Science Specialization


What you'll learn

Describe what data science and machine learning are, their applications & use cases, and various types of tasks performed by data scientists  

Gain hands-on familiarity with common data science tools including JupyterLab, R Studio, GitHub and Watson Studio 

Develop the mindset to work like a data scientist, and follow a methodology to tackle different types of data science problems

Write SQL statements and query Cloud databases using Python from Jupyter notebooks

Join Free: Introduction to Data Science Specialization

Specialization - 4 course series

Interested in learning more about data science, but don’t know where to start? This 4-course Specialization from IBM will provide you with the key foundational skills any data scientist needs to prepare you for a career in data science or further advanced learning in the field.  

This Specialization will introduce you to what data science is and what data scientists do. You’ll discover the applicability of data science across fields, and learn how data analysis can help you make data driven decisions. You’ll find that you can kickstart your career path in the field without prior knowledge of computer science or programming languages: this Specialization will give you the foundation you need for more advanced learning to support your career goals.

You’ll grasp concepts like big data, statistical analysis, and relational databases, and gain familiarity with various open source tools and data science programs used by data scientists, like Jupyter Notebooks, RStudio, GitHub, and SQL. You'll complete hands-on labs and projects to learn the methodology involved in tackling data science problems and apply your newly acquired skills and knowledge to real world data sets.

In addition to earning a Specialization completion certificate from Coursera, you’ll also receive a digital badge from IBM recognizing you as a specialist in data science foundations.

This Specialization can also be applied toward the 
IBM Data Science Professional Certificate. 

Applied Learning Project

All courses in the specialization contain multiple hands-on labs and assignments to help you gain practical experience and skills with a variety of data sets and tools like Jupyter, GitHub, and R Studio. Build your data science portfolio from the artifacts you produce throughout this program. Course-culminating projects include:

Creating and sharing a Jupyter Notebook containing code blocks and markdown

Devising a problem that can be solved by applying the data science methodology and explain how to apply each stage of the methodology to solve it

Using SQL to query census, crime, and demographic data sets to identify causes that impact enrollment, safety, health, and environment ratings in schools

Popular Posts

Categories

100 Python Programs for Beginner (56) AI (34) Android (24) AngularJS (1) Assembly Language (2) aws (17) Azure (7) BI (10) book (4) Books (174) C (77) C# (12) C++ (82) Course (67) Coursera (228) Cybersecurity (24) data management (11) Data Science (128) Data Strucures (8) Deep Learning (21) Django (14) Downloads (3) edx (2) Engineering (14) Excel (13) Factorial (1) Finance (6) flask (3) flutter (1) FPL (17) Google (34) Hadoop (3) HTML&CSS (47) IBM (25) IoT (1) IS (25) Java (93) Leet Code (4) Machine Learning (60) Meta (22) MICHIGAN (5) microsoft (4) Nvidia (3) Pandas (4) PHP (20) Projects (29) Python (938) Python Coding Challenge (372) Python Quiz (30) Python Tips (2) Questions (2) R (70) React (6) Scripting (1) security (3) Selenium Webdriver (4) Software (17) SQL (42) UX Research (1) web application (8) Web development (4) web scraping (2)

Followers

Person climbing a staircase. Learn Data Science from Scratch: online program with 21 courses