Friday, 24 November 2023

Mathematics for Machine Learning (Free PDF)


The fundamental mathematical tools needed to understand machine learning include linear algebra, analytic geometry, matrix decompositions, vector calculus, optimization, probability and statistics. These topics are traditionally taught in disparate courses, making it hard for data science or computer science students, or professionals, to efficiently learn the mathematics. This self contained textbook bridges the gap between mathematical and machine learning texts, introducing the mathematical concepts with a minimum of prerequisites. It uses these concepts to derive four central machine learning methods: linear regression, principal component analysis, Gaussian mixture models and support vector machines. For students and others with a mathematical background, these derivations provide a starting point to machine learning texts. For those learning the mathematics for the first time, the methods help build intuition and practical experience with applying mathematical concepts. Every chapter includes worked examples and exercises to test understanding. Programming tutorials are offered on the book's web site.

Buy : Mathematics for Machine Learning


PDF Downloads: Mathematics for Machine Learning

Probabilistic Machine Learning: An Introduction (Adaptive Computation and Machine Learning series) (Free PDF)


A detailed and up-to-date introduction to machine learning, presented through the unifying lens of probabilistic modeling and Bayesian decision theory.

This book offers a detailed and up-to-date introduction to machine learning (including deep learning) through the unifying lens of probabilistic modeling and Bayesian decision theory. The book covers mathematical background (including linear algebra and optimization), basic supervised learning (including linear and logistic regression and deep neural networks), as well as more advanced topics (including transfer learning and unsupervised learning). End-of-chapter exercises allow students to apply what they have learned, and an appendix covers notation.

Probabilistic Machine Learning grew out of the author’s 2012 book, Machine Learning: A Probabilistic Perspective. More than just a simple update, this is a completely new book that reflects the dramatic developments in the field since 2012, most notably deep learning. In addition, the new book is accompanied by online Python code, using libraries such as scikit-learn, JAX, PyTorch, and Tensorflow, which can be used to reproduce nearly all the figures; this code can be run inside a web browser using cloud-based notebooks, and provides a practical complement to the theoretical topics discussed in the book. This introductory text will be followed by a sequel that covers more advanced topics, taking the same probabilistic approach.

Buy : Probabilistic Machine Learning: An Introduction (Adaptive Computation and Machine Learning series)


Download : Probabilistic Machine Learning: An Introduction (Adaptive Computation and Machine Learning series)

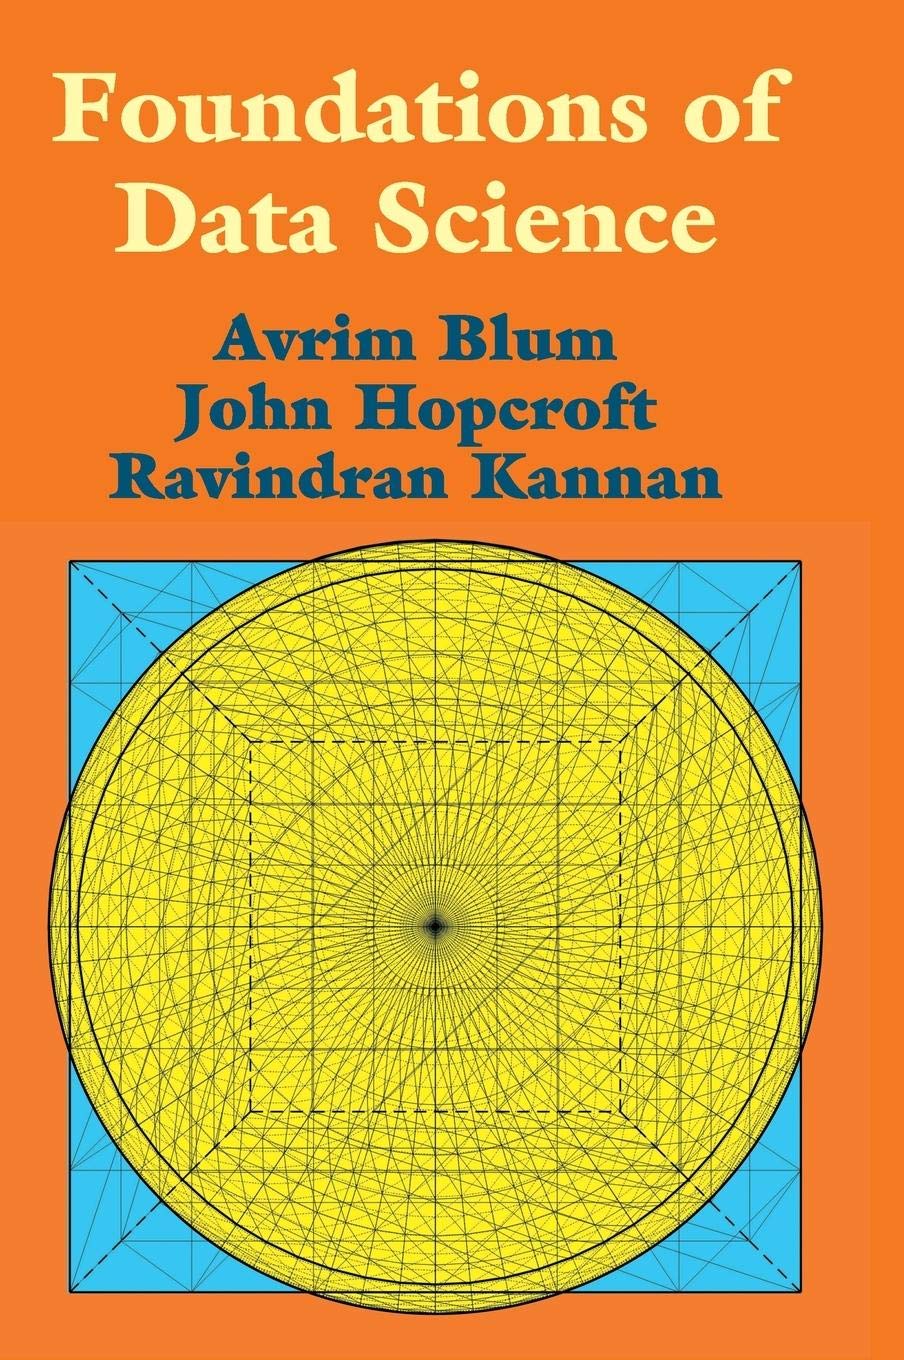
Foundations of Data Science (Free PDF)


This book provides an introduction to the mathematical and algorithmic foundations of data science, including machine learning, high-dimensional geometry, and analysis of large networks. Topics include the counterintuitive nature of data in high dimensions, important linear algebraic techniques such as singular value decomposition, the theory of random walks and Markov chains, the fundamentals of and important algorithms for machine learning, algorithms and analysis for clustering, probabilistic models for large networks, representation learning including topic modelling and non-negative matrix factorization, wavelets and compressed sensing. Important probabilistic techniques are developed including the law of large numbers, tail inequalities, analysis of random projections, generalization guarantees in machine learning, and moment methods for analysis of phase transitions in large random graphs. Additionally, important structural and complexity measures are discussed such as matrix norms and VC-dimension. This book is suitable for both undergraduate and graduate courses in the design and analysis of algorithms for data.

Buy : Foundations of Data Science


Download: Foundations of Data Science

Book Description

Covers mathematical and algorithmic foundations of data science: machine learning, high-dimensional geometry, and analysis of large networks.

About the Author

Avrim Blum is Chief Academic Officer at Toyota Technical Institute at Chicago and formerly Professor at Carnegie Mellon University, Pennsylvania. He has over 25,000 citations for his work in algorithms and machine learning. He has received the AI Journal Classic Paper Award, ICML/COLT 10-Year Best Paper Award, Sloan Fellowship, NSF NYI award, and Herb Simon Teaching Award, and is a Fellow of the Association for Computing Machinery (ACM).

John Hopcroft is a member of the National Academy of Sciences and National Academy of Engineering, and a foreign member of the Chinese Academy of Sciences. He received the Turing Award in 1986, was appointed to the National Science Board in 1992 by President George H. W. Bush, and was presented with the Friendship Award by Premier Li Keqiang for his work in China.

Ravi Kannan is Principal Researcher for Microsoft Research, India. He was the recipient of the Fulkerson Prize in Discrete Mathematics (1991) and the Knuth Prize (ACM) in 2011. He is a distinguished alumnus of the Indian Institute of Technology, Bombay, and his past faculty appointments include Massachusetts Institute of Technology, Carnegie Mellon University, Pennsylvania, Yale University, Connecticut, and the Indian Institute of Science.

a = 10 if a = 30 or 40 or 60 : print('Hello') else : print('Hi')

Code :

a = 10

if a = 30 or 40 or 60 :

print('Hello')

else :

print('Hi')


Solution and Explanation:

Answer : Error

The equality comparison should use == instead of =. Second, you need to compare the variable a against each value separately. Here's the corrected version:

a = 10
if a == 30 or a == 40 or a == 60:
    print('Hello')
else:
    print('Hi')

This way, it checks if a is equal to any of the specified values (30, 40, or 60) and prints 'Hello' if true, otherwise, it prints 'Hi'.


Improving your statistical inferences (Free Course)


There are 8 modules in this course

This course aims to help you to draw better statistical inferences from empirical research. First, we will discuss how to correctly interpret p-values, effect sizes, confidence intervals, Bayes Factors, and likelihood ratios, and how these statistics answer different questions you might be interested in. Then, you will learn how to design experiments where the false positive rate is controlled, and how to decide upon the sample size for your study, for example in order to achieve high statistical power. Subsequently, you will learn how to interpret evidence in the scientific literature given widespread publication bias, for example by learning about p-curve analysis. Finally, we will talk about how to do philosophy of science, theory construction, and cumulative science, including how to perform replication studies, why and how to pre-register your experiment, and how to share your results following Open Science principles. 

In practical, hands on assignments, you will learn how to simulate t-tests to learn which p-values you can expect, calculate likelihood ratio's and get an introduction the binomial Bayesian statistics, and learn about the positive predictive value which expresses the probability published research findings are true. We will experience the problems with optional stopping and learn how to prevent these problems by using sequential analyses. You will calculate effect sizes, see how confidence intervals work through simulations, and practice doing a-priori power analyses. Finally, you will learn how to examine whether the null hypothesis is true using equivalence testing and Bayesian statistics, and how to pre-register a study, and share your data on the Open Science Framework.

Join Free - Improving your statistical inferences


What will be the output of the following code snippet? num1 = num2 = (10, 20, 30, 40, 50) print(id(num1), type(num2)) print(isinstance(num1, tuple)) print(num1 is num2) print(num1 is not num2) print(20 in num1) print(30 not in num2)

What will be the output of the following code snippet?

num1 = num2 = (10, 20, 30, 40, 50)

  1. print(id(num1), type(num2))
  2. print(isinstance(num1, tuple))
  3. print(num1 is num2)
  4. print(num1 is not num2)
  5. print(20 in num1)
  6. print(30 not in num2)


Solution and Explanation: 

num1 and num2 are both assigned the same tuple (10, 20, 30, 40, 50).

  1. print(id(num1), type(num2)) prints the identity and type of num1. Since num1 and num2 reference the same tuple, they will have the same identity. The output will show the identity and type of the tuple.
  2. print(isinstance(num1, tuple)) checks if num1 is an instance of the tuple class and prints True because num1 is a tuple.
  3. print(num1 is num2) checks if num1 and num2 refer to the same object. Since they are both assigned the same tuple, this will print True.
  4. print(num1 is not num2) checks if num1 and num2 do not refer to the same object. Since they are the same tuple, this will print False.
  5. print(20 in num1) checks if the value 20 is present in the tuple num1. It will print True.
  6. print(30 not in num2) checks if the value 30 is not present in the tuple num2. It will print False.
The output of the code will look something like this:

(id_of_tuple, <class 'tuple'>)
True
True
False
True
False

num1 = [10, 20] num2 = [30] num1.append(num2) print(num1)

Code - 

num1 = [10, 20]

num2 = [30]

num1.append(num2)

print(num1)

Solution and Explanation :


The above code appends the list num2 as a single element to the list num1. So, num1 becomes a nested list. Here's the breakdown of the code:

num1 = [10, 20]
num2 = [30]
num1.append(num2)
print(num1)
num1 is initially [10, 20].
num2 is [30].
num1.append(num2) appends num2 as a single element to num1, resulting in num1 becoming [10, 20, [30]].
print(num1) prints the updated num1.
The output of the code will be: [10, 20, [30]]

Introduction to Microsoft Excel (Free Course)


What you'll learn

Create an Excel spreadsheet and learn how to maneuver around the spreadsheet for data entry.

Create simple formulas in an Excel spreadsheet to analyze data.

Learn, practice, and apply job-ready skills in less than 2 hours

Receive training from industry experts

Gain hands-on experience solving real-world job tasks

Build confidence using the latest tools and technologies

About this Guided Project

By the end of this project, you will learn how to create an Excel Spreadsheet by using a free version of Microsoft Office Excel.  

Excel is a spreadsheet that works like a database. It consists of individual cells that can be used to build functions, formulas, tables, and graphs that easily organize and analyze large amounts of information and data. Excel is organized into rows (represented by numbers) and columns (represented by letters) that contain your information. This format allows you to present large amounts of information and data in a concise and easy to follow format. Microsoft Excel is the most widely used software within the business community. Whether it is bankers or accountants or business analysts or marketing professionals or scientists or entrepreneurs, almost all professionals use Excel on a consistent basis. 

You will learn what an Excel Spreadsheet is, why we use it and the most important keyboard shortcuts, functions, and basic formulas.

Join Free - Introduction to Microsoft Excel

Thursday, 23 November 2023

Python Coding challenge - Day 75 | What is the output of the following Python code?


Code : 

lst = [10, 25, 4, 12, 3, 8]

sorted(lst)

print(lst)


Solution and Explanation :

The above code sorts the list lst using the sorted() function, but it doesn't modify the original list. The sorted() function returns a new sorted list without changing the original list. If you want to sort the original list in-place, you can use the sort() method of the list:


lst = [10, 25, 4, 12, 3, 8]
lst.sort()
print(lst)

This will modify the original list lst and print the sorted result. If you want to keep the original list unchanged and create a new sorted list, you can use sorted() and assign it to a new variable:

lst = [10, 25, 4, 12, 3, 8]
sorted_lst = sorted(lst)
print(sorted_lst)
print(lst)

In this case, sorted_lst will contain the sorted version of the original list, and lst will remain unchanged.


num = [10, 20, 30, 40, 50] num[2:4] = [ ] print(num)

Code :

num = [10, 20, 30, 40, 50]

num[2:4] = [ ]

print(num)


Solution and Explanation : 

In the provided code, you have a list num containing the elements [10, 20, 30, 40, 50]. Then, you use slicing to modify elements from index 2 to 3 (not including 4) by assigning an empty list [] to that slice. Let's break down the code step by step:

num = [10, 20, 30, 40, 50]

This initializes the list num with the values [10, 20, 30, 40, 50].

num[2:4] = []

This line modifies the elements at index 2 and 3 (not including 4) by assigning an empty list [] to that slice. As a result, the elements at index 2 and 3 are removed.

After this operation, the list num will be:

[10, 20, 50]

So, the final output of print(num) will be: [10, 20, 50]

Deep Learning Specialization


What you'll learn

Build and train deep neural networks, identify key architecture parameters, implement vectorized neural networks and deep learning to applications

Train test sets, analyze variance for DL applications, use standard techniques and optimization algorithms, and build neural networks in TensorFlow

Build a CNN and apply it to detection and recognition tasks, use neural style transfer to generate art, and apply algorithms to image and video data

Build and train RNNs, work with NLP and Word Embeddings, and use HuggingFace tokenizers and transformer models to perform NER and Question Answering

Specialization - 5 course series

The Deep Learning Specialization is a foundational program that will help you understand the capabilities, challenges, and consequences of deep learning and prepare you to participate in the development of leading-edge AI technology. 

In this Specialization, you will build and train neural network architectures such as Convolutional Neural Networks, Recurrent Neural Networks, LSTMs, Transformers, and learn how to make them better with strategies such as Dropout, BatchNorm, Xavier/He initialization, and more. Get ready to master theoretical concepts and their industry applications using Python and TensorFlow and tackle real-world cases such as speech recognition, music synthesis, chatbots, machine translation, natural language processing, and more.

AI is transforming many industries. The Deep Learning Specialization provides a pathway for you to take the definitive step in the world of AI by helping you gain the knowledge and skills to level up your career. Along the way, you will also get career advice from deep learning experts from industry and academia.

Applied Learning Project

By the end you’ll be able to:

 • Build and train deep neural networks, implement vectorized neural networks, identify architecture parameters, and apply DL to your applications

• Use best practices to train and develop test sets and analyze bias/variance for building DL applications, use standard NN techniques, apply optimization algorithms, and implement a neural network in TensorFlow

• Use strategies for reducing errors in ML systems, understand complex ML settings, and apply end-to-end, transfer, and multi-task learning

• Build a Convolutional Neural Network, apply it to visual detection and recognition tasks, use neural style transfer to generate art, and apply these algorithms to image, video, and other 2D/3D data

• Build and train Recurrent Neural Networks and its variants (GRUs, LSTMs), apply RNNs to character-level language modeling, work with NLP and Word Embeddings, and use HuggingFace tokenizers and transformers to perform Named Entity Recognition and Question Answering

JOIN Free - Deep Learning Specialization

How will you create an empty list, empty tuple, empty set and empty dictionary?

lst = [ ]

tpl = ( )

s = set( )

dct = { }


Empty List:

empty_list = []


Empty Tuple:

empty_tuple = ()


Empty Set:

empty_set = set()


Empty Dictionary:

empty_dict = {}


Alternatively, for the empty dictionary, you can use the dict() constructor as well:

empty_dict = dict()

1. print(6 // 2) 2. print(3 % -2) 3. print(-2 % -4) 4. print(17 / 4) 5. print(-5 // -3)

1. print(6 // 2)


2. print(3 % -2)


3. print(-2 % -4)


4. print(17 / 4)


5. print(-5 // -3)


Let's evaluate each expression:


print(6 // 2)

Output: 3

Explanation: // is the floor division operator, which returns the largest integer that is less than or equal to the result of the division. In this case, 6 divided by 2 is 3.


print(3 % -2)

Output: -1

Explanation: % is the modulo operator, which returns the remainder of the division. In this case, the remainder of 3 divided by -2 is -1.


print(-2 % -4)

Output: -2

Explanation: Similar to the previous example, the remainder of -2 divided by -4 is -2.


print(17 / 4)

Output: 4.25

Explanation: / is the division operator, and it returns the quotient of the division. In this case, 17 divided by 4 is 4.25.


print(-5 // -3)

Output: 1

Explanation: The floor division of -5 by -3 is 1. The result is rounded down to the nearest integer.

a = [1, 2, 3, 4] b = [1, 2, 5] print(a < b)

 In Python, when comparing lists using the less than (<) operator, the lexicographical (dictionary) order is considered. The comparison is performed element-wise until a difference is found. In your example:

a = [1, 2, 3, 4]

b = [1, 2, 5]

print(a < b)

The comparison starts with the first elements: 1 in a and 1 in b. Since they are equal, the comparison moves to the next elements: 2 in a and 2 in b. Again, they are equal. Finally, the comparison reaches the third elements: 3 in a and 5 in b. At this point, 3 is less than 5, so the result of the comparison is True.

Therefore, the output of the code will be: True

Wednesday, 22 November 2023

Python Coding challenge - Day 74 | What is the output of the following Python code?


Code - 

fruits = {'Kiwi', 'Jack Fruit', 'Lichi'}
fruits.clear( )
print(fruits)

Solution and Explanation: 

The variable fruits seems to be defined as a set, but you are trying to use the clear() method on it, which is applicable to dictionaries, not sets. If you want to clear a set, you can use the clear() method directly on the set. Here's the corrected code:

fruits = {'Kiwi', 'Jack Fruit', 'Lichi'}

fruits.clear()

print(fruits)

This will output an empty set:

set()

If you intended fruits to be a dictionary, you should define it using key-value pairs, like this:

fruits = {'kiwi': 1, 'jackfruit': 2, 'lichi': 3}

fruits.clear()

print(fruits)

This will output an empty dictionary:

{}

10 FREE coding courses from University of Michigan

Advanced Portfolio Construction and Analysis with Python


What you'll learn

Analyze style and factor exposures of portfolios  

 Implement robust estimates for the covariance matrix  

Implement Black-Litterman portfolio construction analysis  

Implement a variety of robust portfolio construction models  


There are 4 modules in this course

The practice of investment management has been transformed in recent years by computational methods. Instead of merely explaining the science, we help you build on that foundation in a practical manner, with an emphasis on the hands-on implementation of those ideas in the Python programming language. In this course, we cover the estimation, of risk and return parameters for meaningful portfolio decisions, and also introduce a variety of state-of-the-art portfolio construction techniques that have proven popular in investment management and portfolio construction due to their enhanced robustness.

As we cover the theory and math in lecture videos, we'll also implement the concepts in Python, and you'll be able to code along with us so that you have a deep and practical understanding of how those methods work. By the time you are done, not only will you have a foundational understanding of modern computational methods in investment management, you'll have practical mastery in the implementation of those methods. If you follow along and implement all the lab exercises, you will complete the course with a powerful toolkit that you will be able to use to perform your own analysis and build your own implementations and perhaps even use your newly acquired knowledge to improve on current methods. 

Join free  - Advanced Portfolio Construction and Analysis with Python

Inferential Statistical Analysis with Python


What you'll learn

Determine assumptions needed to calculate confidence intervals for their respective population parameters.

Create confidence intervals in Python and interpret the results.

Review how inferential procedures are applied and interpreted step by step when analyzing real data.

Run hypothesis tests in Python and interpret the results.

There are 4 modules in this course

In this course, we will explore basic principles behind using data for estimation and for assessing theories. We will analyze both categorical data and quantitative data, starting with one population techniques and expanding to handle comparisons of two populations. We will learn how to construct confidence intervals. We will also use sample data to assess whether or not a theory about the value of a parameter is consistent with the data. A major focus will be on interpreting inferential results appropriately.  

At the end of each week, learners will apply what they’ve learned using Python within the course environment. During these lab-based sessions, learners will work through tutorials focusing on specific case studies to help solidify the week’s statistical concepts, which will include further deep dives into Python libraries including Statsmodels, Pandas, and Seaborn. This course utilizes the Jupyter Notebook environment within Coursera. 

Join free - Inferential Statistical Analysis with Python

s = { } t = {1, 4, 5, 2, 3} print(type(s), type(t))

s = { }

t = {1, 4, 5, 2, 3}

print(type(s), type(t))

<class 'dict'> <class 'set'>


The first line initializes an empty dictionary s using curly braces {}, and the second line initializes a set t with the elements 1, 4, 5, 2, and 3 using curly braces as well.


The print(type(s), type(t)) statement then prints the types of s and t. When you run this code, the output will be:

<class 'dict'> <class 'set'>

This indicates that s is of type dict (dictionary) and t is of type set. If you want s to be an empty set, you should use the set() constructor:

s = set()

t = {1, 4, 5, 2, 3}

print(type(s), type(t))

With this corrected code, the output will be:

<class 'set'> <class 'set'>

Now both s and t will be of type set.

s1 = {10, 20, 30, 40, 50} s2 = {10, 20, 30, 40, 50} s3 = {*s1, *s2} print(s3) Output {40, 10, 50, 20, 30}

 s1 = {10, 20, 30, 40, 50}

s2 = {10, 20, 30, 40, 50}

s3 = {*s1, *s2}

print(s3)

Output

{40, 10, 50, 20, 30}


In the provided code, three sets s1, s2, and s3 are defined. s1 and s2 contain the same elements: 10, 20, 30, 40, and 50. Then, s3 is created by unpacking the elements of both s1 and s2. Finally, the elements of s3 are printed.

Here's the step-by-step explanation:

s1 is defined as the set {10, 20, 30, 40, 50}.

s2 is defined as the set {10, 20, 30, 40, 50}, which is the same as s1.

s3 is defined as the set resulting from unpacking the elements of both s1 and s2 using the * operator. This means that the elements of s1 and s2 are combined into a new set.

The print statement prints the elements of the set s3.

Since sets do not allow duplicate elements, the resulting set s3 will still have only unique elements. In this case, the output of the code will be:

{10, 20, 30, 40, 50}

Tuesday, 21 November 2023

Python Coding challenge - Day 73 | What is the output of the following Python code?


Code - 

i, j, k = 4, -1, 0

w = i or j or k      # w = (4 or -1) or 0 = 4

x = i and j and k    # x = (4 and -1) and 0 = 0

y = i or j and k     # y = (4 or -1) and 0 = 4

z = i and j or k     # z = (4 and -1) or 0 = -1

print(w, x, y, z)

Solution and Explanation - 

Here's the explanation for each variable:

w: It takes the first non-zero value from left to right in the sequence (i, j, k). In this case, the first non-zero value is 4.
x: It takes the first zero value from left to right in the sequence (i, j, k). In this case, the first zero value is 0.
y: It takes the first non-zero value from left to right in the sequence (i, j) and then evaluates the result with k using the "and" operator. In this case, (4 or -1) evaluates to 4, and 4 and 0 evaluates to 0.
z: It takes the first non-zero value from left to right in the sequence (i, j) and then evaluates the result with k using the "or" operator. In this case, (4 and -1) evaluates to -1, and -1 or 0 evaluates to -1.

So, the output of the print statement will be: 4 0 4 -1


From Excel to Power BI (Free Course)


What you'll learn

Learners will be instructed in how to make use of Excel and Power BI to collect, maintain, share and collaborate, and to make data driven decisions

There is 1 module in this course

Are you using Excel to manage, analyze, and visualize your data? Would you like to do more? Perhaps you've considered Power BI as an alternative, but have been intimidated by the idea of working in an advanced environment. The fact is, many of the same tools and mechanisms exist across both these Microsoft products. This means Excel users are actually uniquely positioned to transition to data modeling and visualization in Power BI! Using methods that will feel familiar, you can learn to use Power BI to make data-driven business decisions using large volumes of data. 


We will help you to build fundamental Power BI knowledge and skills, including: 

Importing data from Excel and other locations into Power BI.

Understanding the Power BI environment and its three Views.

Building beginner-to-moderate level skills for navigating the Power BI product.

Exploring influential relationships within datasets. 

Designing Power BI visuals and reports.

Building effective dashboards for sharing, presenting, and collaborating with peers in Power BI Service.


For this course you will need:

A basic understanding of data analysis processes in Excel.

At least a free Power BI licensed account, including:

The Power BI desktop application.

Power BI Online in Microsoft 365.

Course duration is approximately three hours. Learning is divided into five modules, the fifth being a cumulative assessment. The curriculum design includes video lessons, interactive learning using short, how-to video tutorials, and practice opportunities using COMPLIMENTARY DATASETS. Intended audiences include business students, small business owners, administrative assistants, accountants, retail managers, estimators, project managers, business analysts, and anyone who is inclined to make data-driven business decisions. Join us for the journey!

Join Free - From Excel to Power BI

Meta Front-End Developer Professional Certificate


What you'll learn

Create a responsive website using HTML to structure content, CSS to handle visual style, and JavaScript to develop interactive experiences. 

Learn to use React in relation to Javascript libraries and frameworks.

Learn Bootstrap CSS Framework to create webpages and work with GitHub repositories and version control.

Prepare for a coding interview, learn best approaches to problem-solving, and build portfolio-ready projects you can share during job interviews.


Prepare for a career in Front-end Development

Receive professional-level training from Meta

Demonstrate your proficiency in portfolio-ready projects

Earn an employer-recognized certificate from Meta

Qualify for in-demand job titles: Front-End Developer, Website Developer, Software Engineer


Professional Certificate - 9 course series

Want to get started in the world of coding and build websites as a career? This certificate, designed by the software engineering experts at Meta—the creators of Facebook and Instagram, will prepare you for a career as a front-end developer.

In this program, you’ll learn: 

How to code and build interactive web pages using HTML5, CSS and JavaScript. 

In-demand design skills to create professional page layouts using industry-standard tools such as Bootstrap, React, and Figma. 

GitHub repositories for version control, content management system (CMS) and how to edit images using Figma. 

How to prepare for technical interviews for front-end developer roles.

By the end, you’ll put your new skills to work by completing a real-world project where you’ll create your own front-end web application. Any third-party trademarks and other intellectual property (including logos and icons) referenced in the learning experience remain the property of their respective owners. Unless specifically identified as such, Coursera’s use of third-party intellectual property does not indicate any relationship, sponsorship, or endorsement between Coursera and the owners of these trademarks or other intellectual property.

Applied Learning Project

Throughout the program, you’ll engage in hands-on activities that offer opportunities to practice and implement what you are learning. You’ll complete hands-on projects that you can showcase during job interviews and on relevant social networks.

At the end of each course, you’ll complete a project to test your new skills and ensure you understand the criteria before moving on to the next course. There are 9 projects in which you’ll use a lab environment or a web application to perform tasks such as:  

Edit your Bio page—using your skills in HTML5, CSS and UI frameworks

Manage a project in GitHub—using version control in Git, Git repositories and the Linux Terminal 

Build a static version of an application—you’ll apply your understanding of React, frameworks, routing, hooks, bundlers and data fetching. 

At the end of the program, there will be a Capstone project where you will bring your new skillset together to create the front-end web application.

Join - Meta Front-End Developer Professional Certificate

Introduction to Statistics (Free Course)


There are 12 modules in this course

Stanford's "Introduction to Statistics" teaches you statistical thinking concepts that are essential for learning from data and communicating insights. By the end of the course, you will be able to perform exploratory data analysis, understand key principles of sampling, and select appropriate tests of significance for multiple contexts. You will gain the foundational skills that prepare you to pursue more advanced topics in statistical thinking and machine learning.

Topics include Descriptive Statistics, Sampling and Randomized Controlled Experiments, Probability, Sampling Distributions and the Central Limit Theorem, Regression, Common Tests of Significance, Resampling, Multiple Comparisons.

Free Course - Introduction to Statistics


IBM Full Stack Software Developer Professional Certificate


What you'll learn

Master the most up-to-date practical skills and tools that full stack developers use in their daily roles

Learn how to deploy and scale applications using Cloud Native methodologies and tools such as Containers, Kubernetes, Microservices, and Serverless

Develop software with front-end development languages and tools such as HTML, CSS, JavaScript, React, and Bootstrap

Build your GitHub portfolio by applying your skills to multiple labs and hands-on projects, including a capstone

Professional Certificate - 12 course series

Prepare for a career in the high-growth field of software development. In this program, you’ll learn in-demand skills and tools used by professionals for front-end, back-end, and cloud native application development to get job-ready in less than 4 months, with no prior experience needed. 

Full stack refers to the end-to-end computer system application, including the front end and back end coding. This Professional Certificate covers development for both of these scenarios. Cloud native development refers to developing a program designed to work on cloud architecture. The flexibility and adaptability that full stack and cloud native developers provide make them highly sought after in this digital world. 

You’ll  learn how to build, deploy, test, run, and manage full stack cloud native applications. Technologies covered includes Cloud foundations, GitHub, Node.js, React, CI/CD, Containers, Docker, Kubernetes, OpenShift, Istio, Databases, NoSQL, Django ORM, Bootstrap, Application Security, Microservices, Serverless computing, and more. 

After completing the program you will have developed several applications using front-end and back-end technologies and deployed them on a cloud platform using Cloud Native methodologies. You will publish these projects through your GitHub repository to share your portfolio with your peers and prospective employers.

This program is ACE® recommended—when you complete, you can earn up to 18 college credits.

Applied Learning Project

Throughout the courses in the Professional Certificate, you will develop a portfolio of hands-on projects involving various popular technologies and programming languages in Full Stack Cloud Application Development. These projects include creating:

HTML pages on Cloud Object Storage

An interest rate calculator using HTML, CSS, and JavaScript

An AI program deployed on Cloud Foundry using DevOps principles and CI/CD toolchains with a NoSQL database

A Node.js back-end application and a React front-end application

A containerized guestbook app packaged with Docker deployed with Kubernetes and managed with OpenShift

A Python app bundled as a package

A database-powered application using Django ORM and Bootstrap

An app built using Microservices & Serverless

A scalable, Cloud Native Full Stack application using the technologies learned in previous courses

You will publish these projects through your GitHub repository to share your skills with your peers and prospective employers.

Join - IBM Full Stack Software Developer Professional Certificate

Meta Back-End Developer Professional Certificate


What you'll learn

Gain the technical skills required to become a qualified back-end developer

Learn to use programming systems including Python Syntax, Linux commands, Git, SQL, Version Control, Cloud Hosting, APIs, JSON, XML and more

Build a portfolio using your new skills and begin interview preparation including tips for what to expect when interviewing for engineering jobs

Learn in-demand programming skills and how to confidently use code to solve problems

Professional Certificate - 9 course series

Ready to gain new skills and the tools developers use to create websites and web applications? This certificate, designed by the software engineering experts at  Meta—the creators of Facebook and Instagram, will prepare you for an entry-level career as a back-end developer. 


In this program, you’ll learn:

Python Syntax—the most popular choice for machine learning, data science and artificial intelligence.

In-demand programming skills and how to confidently use code to solve problems. 

Linux commands and Git repositories to implement version control.

The world of data storage and databases using MySQL, and how to craft sophisticated SQL queries. 

Django web framework and how the front-end consumes data from the REST APIs. 

How to prepare for technical interviews for back-end developer roles.

Any third-party trademarks and other intellectual property (including logos and icons) referenced in the learning experience remain the property of their respective owners. Unless specifically identified as such, Coursera’s use of third-party intellectual property does not indicate any relationship, sponsorship, or endorsement between Coursera and the owners of these trademarks or other intellectual property.

Applied Learning Project

Throughout the program, you’ll engage in applied learning through hands-on activities to help level up your knowledge. At the end of each course, you’ll complete 10 micro-projects that will help prepare you for the next steps in your engineer career journey. 

In these projects, you’ll use a lab environment or a web application to perform tasks such as:   

Solve problems using Python code. 

Manage a project in GitHub using version control in Git, Git repositories and the Linux Terminal. 

Design and build a simple Django app. 

At the end of the program, there will be a Capstone project where you will bring all of your knowledge together to create a Django web app.

Join - Meta Back-End Developer Professional Certificate

Monday, 20 November 2023

MITx: Machine Learning with Python: from Linear Models to Deep Learning (Free Course)


What you'll learn

Understand principles behind machine learning problems such as classification, regression, clustering, and reinforcement learning

Implement and analyze models such as linear models, kernel machines, neural networks, and graphical models

Choose suitable models for different applications

Implement and organize machine learning projects, from training, validation, parameter tuning, to feature engineering.

Syllabus

Lectures :

Introduction

Linear classifiers, separability, perceptron algorithm

Maximum margin hyperplane, loss, regularization

Stochastic gradient descent, over-fitting, generalization

Linear regression

Recommender problems, collaborative filtering

Non-linear classification, kernels

Learning features, Neural networks

Deep learning, back propagation

Recurrent neural networks

Generalization, complexity, VC-dimension

Unsupervised learning: clustering

Generative models, mixtures

Mixtures and the EM algorithm

Learning to control: Reinforcement learning

Reinforcement learning continued

Applications: Natural Language Processing

Projects :

Automatic Review Analyzer

Digit Recognition with Neural Networks

Reinforcement Learning


Join Free - MITx: Machine Learning with Python: from Linear Models to Deep Learning

IBM: Machine Learning with Python: A Practical Introduction (Free Course)


About this course

Please Note: Learners who successfully complete this IBM course can earn a skill badge — a detailed, verifiable and digital credential that profiles the knowledge and skills you’ve acquired in this course. Enroll to learn more, complete the course and claim your badge!

This Machine Learning with Python course dives into the basics of machine learning using Python, an approachable and well-known programming language. You'll learn about supervised vs. unsupervised learning, look into how statistical modeling relates to machine learning, and do a comparison of each.

We'll explore many popular algorithms including Classification, Regression, Clustering, and Dimensional Reduction and popular models such as Train/Test Split, Root Mean Squared Error (RMSE), and Random Forests. Along the way, you’ll look at real-life examples of machine learning and see how it affects society in ways you may not have guessed!

Most importantly, you will transform your theoretical knowledge into practical skill using hands-on labs. Get ready to do more learning than your machine!

We'll explore many popular algorithms including Classification, Regression, Clustering, and Dimensional Reduction and popular models such asTrain/Test Split, Root Mean Squared Error and Random Forests.

Mostimportantly, you will transform your theoretical knowledge into practical skill using hands-on labs. Get ready to do more learning than your machine!

Join Free - IBM: Machine Learning with Python: A Practical Introduction

Saturday, 18 November 2023

Write a program to generate all Pythagorean Triplets with side length less than or equal to 50.

 Certainly! Let me explain the code step by step:

# Function to check if a, b, c form a Pythagorean triplet

def is_pythagorean_triplet(a, b, c):

    return a**2 + b**2 == c**2

This part defines a function is_pythagorean_triplet that takes three arguments (a, b, and c) and returns True if they form a Pythagorean triplet (satisfy the Pythagorean theorem), and False otherwise.

# Generate and print all Pythagorean triplets with side lengths <= 50

for a in range(1, 51):

    for b in range(a, 51):

Here, two nested for loops are used. The outer loop iterates over values of a from 1 to 50. The inner loop iterates over values of b from a to 50. The inner loop starts from a to avoid duplicate triplets (e.g., (3, 4, 5) and (4, 3, 5) are considered duplicates).

        c = (a**2 + b**2)**0.5  # Calculate c using the Pythagorean theorem

        if c.is_integer() and c <= 50:

            print(f"Pythagorean Triplet: ({a}, {b}, {int(c)})")

Within the loops, the program calculates the value of c using the Pythagorean theorem (c = sqrt(a^2 + b^2)). The is_integer() method is then used to check if c is a whole number. If it is, and if c is less than or equal to 50, the triplet (a, b, c) is printed as a Pythagorean triplet.


# Function to check if a, b, c form a Pythagorean triplet

def is_pythagorean_triplet(a, b, c):

    return a**2 + b**2 == c**2


# Generate and print all Pythagorean triplets with side lengths <= 50

for a in range(1, 51):

    for b in range(a, 51):

        c = (a**2 + b**2)**0.5  # Calculate c using the Pythagorean theorem

        if c.is_integer() and c <= 50:

            print(f"Pythagorean Triplet: ({a}, {b}, {int(c)})")


Rewrite the following program using for loop. lst = ['desert', 'dessert', 'to', 'too', 'lose', 'loose'] s = 'Mumbai' i = 0 while i < len(lst) : if i > 3 : break else : print(i, lst[i], s[i]) i += 1

 Rewrite the following program using for loop.

lst = ['desert', 'dessert', 'to', 'too', 'lose', 'loose']

s = 'Mumbai'

i = 0

while i < len(lst) :

if i > 3 :

break

else :

print(i, lst[i], s[i])

i += 1


Here's the equivalent program using a for loop:

lst = ['desert', 'dessert', 'to', 'too', 'lose', 'loose']

s = 'Mumbai'

for i in range(len(lst)):

    if i > 3:

        break

    else:

        print(i, lst[i], s[i])

In this version, the for loop iterates over the indices of the lst list using range(len(lst)). The if condition inside the loop checks whether i is greater than 3, and if so, it breaks out of the loop. Otherwise, it prints the values of i, lst[i], and s[i]. The loop increment is handled automatically by the for loop construct, eliminating the need for an explicit increment (i += 1).


Write a program to print first 25 odd numbers using range( ).

 You can use the range() function with a step of 2 to generate odd numbers and then use a loop to print the first 25 odd numbers. Here's a simple Python program to achieve this:

# Using range() to generate the first 25 odd numbers

odd_numbers = list(range(1, 50, 2))[:25]

# Printing the first 25 odd numbers

for number in odd_numbers:

    print(number)

In this program:

range(1, 50, 2) generates odd numbers starting from 1, up to, but not including 50, with a step of 2.

[:25] is used to select the first 25 numbers from the list generated by range().

The loop then prints each of the first 25 odd numbers.


a. range(5) b. range(1, 10, 3) c. range(10, 1, -2) d. range(1, 5) e. range(-2)

a. range(5)

b. range(1, 10, 3) 

c. range(10, 1, -2)

d. range(1, 5) 

e. range(-2) 


Let's break down each of the provided ranges:

a. range(5) - This generates a sequence of integers from 0 to 4 (5 is the stopping value, exclusive). So, it produces the numbers 0, 1, 2, 3, and 4.

b. range(1, 10, 3) - This generates a sequence of integers starting from 1, up to, but not including 10, with a step of 3. So, it produces the numbers 1, 4, 7.

c. range(10, 1, -2) - This generates a sequence of integers starting from 10, down to, but not including 1, with a step of -2. So, it produces the numbers 10, 8, 6, 4, 2.

d. range(1, 5) - This generates a sequence of integers starting from 1, up to, but not including 5. So, it produces the numbers 1, 2, 3, 4.

e. range(-2) - This is a bit different. range() requires at least two arguments (start, stop), but here you've provided only one. If you want to generate a range starting from 0 up to, but not including -2, you would need to provide the start and stop values. If you intended to start from 0 and go up to -2, you could use range(0, -2), which would produce the numbers 0, -1.


So, to summarize:

a. 0, 1, 2, 3, 4

b. 1, 4, 7

c. 10, 8, 6, 4, 2

d. 1, 2, 3, 4

e. (Assuming you meant range(0, -2)) 0, -1

Can a do-while loop be used to repeat a set of statements in Python?

 Python does not have a built-in "do-while" loop like some other programming languages do. However, you can achieve similar behavior using a "while" loop with a break statement.

Here's an example of how you can simulate a "do-while" loop in Python:

while True:

    # Code block to be repeated

    # Ask the user if they want to repeat the loop

    user_input = input("Do you want to repeat? (yes/no): ")

    # Check the user's input

    if user_input.lower() != 'yes':

        break  # Exit the loop if the user does not want to repeat

In this example, the loop will continue to execute the code block and prompt the user for input until the user enters something other than "yes." The break statement is used to exit the loop when the desired condition is met.

This pattern achieves the same effect as a "do-while" loop where the loop body is executed at least once before the condition is checked.

Can a while/for loop be used in an if/else and vice versa in Python?

 Yes, it is entirely valid to use loops within conditional statements (if/else) and vice versa in Python. You can nest loops inside if/else statements and if/else statements inside loops based on the requirements of your program.

Here's an example of a while loop inside an if/else statement:

x = 5

if x > 0:

    while x > 0:

        print(x)

        x -= 1

else:

    print("x is not greater than 0")

And here's an example of an if/else statement inside a for loop:

numbers = [1, 2, 3, 4, 5]

for num in numbers:

    if num % 2 == 0:

        print(f"{num} is even")

    else:

        print(f"{num} is odd")

The key is to maintain proper indentation to denote the block of code within the loop or the conditional statement. This helps Python understand the structure of your code.

Can a while loop be nested within a for loop and vice versa?

Yes, both while loops can be nested within for loops and vice versa in Python. Nesting loops means placing one loop inside another. This is a common programming practice when you need to iterate over elements in a nested structure, such as a list of lists or a matrix.

Here's an example of a while loop nested within a for loop:

for i in range(3):

    print(f"Outer loop iteration {i}")


    j = 0

    while j < 2:

        print(f"  Inner loop iteration {j}")

        j += 1

And here's an example of a for loop nested within a while loop:

i = 0

while i < 3:

    print(f"Outer loop iteration {i}")


    for j in range(2):

        print(f"  Inner loop iteration {j}")


    i += 1

In both cases, the indentation is crucial in Python to define the scope of the loops. The inner loop is indented and considered part of the outer loop based on the indentation level.

Can range( ) function be used to generate numbers from 0.1 to 1.0 in steps of 0.1?

 No, the range() function in Python cannot be used directly to generate numbers with non-integer steps. The range() function is designed for generating sequences of integers.

However, you can achieve the desired result using the numpy library, which provides the arange() function to generate sequences of numbers with non-integer steps. Here's an example:

import numpy as np

# Generate numbers from 0.1 to 1.0 with steps of 0.1

numbers = np.arange(0.1, 1.1, 0.1)

print(numbers)

In this example, np.arange(0.1, 1.1, 0.1) generates an array of numbers starting from 0.1, incrementing by 0.1, and stopping before 1.1.

If a = 10, b = 12, c = 0, find the values of the following expressions: a != 6 and b > 5 a == 9 or b < 3 not ( a < 10 ) not ( a > 5 and c ) 5 and c != 8 or c

Questions - 

 If a = 10, b = 12, c = 0, find the values of the following expressions:

a != 6 and b > 5

a == 9 or b < 3

not ( a < 10 )

not ( a > 5 and c )

5 and c != 8 or c


Solution and Explanations 

Let's evaluate each expression using the given values:

a != 6 and b > 5

a != 6 is True (because 10 is not equal to 6).

b > 5 is also True (because 12 is greater than 5).

The and operator returns True only if both expressions are True.

Therefore, the result is True.


a == 9 or b < 3

a == 9 is False (because 10 is not equal to 9).

b < 3 is False (because 12 is not less than 3).

The or operator returns True if at least one expression is True.

Since both expressions are False, the result is False.


not (a < 10)

a < 10 is False (because 10 is not less than 10).

The not operator negates the result, so not False is True.


not (a > 5 and c)

a > 5 is True because 10 is greater than 5.

c is 0.

a > 5 and c evaluates to True and 0, which is False because and returns the first False value encountered.

The not operator negates the result, so not (True and 0) is not False, which is True.

Therefore, the output of the code will be True.


5 and c != 8 or c

5 is considered True in a boolean context.

c != 8 is True (because 0 is not equal to 8).

The and operator returns the last evaluated expression if all are True, so it evaluates to True.

The or operator returns True if at least one expression is True.

Therefore, the result is True.


Hands-On Data Analysis with NumPy and pandas (Free PDF)


Key Features

  • Explore the tools you need to become a data analyst
  • Discover practical examples to help you grasp data processing concepts
  • Walk through hierarchical indexing and grouping for data analysis

Book Description

Python, a multi-paradigm programming language, has become the language of choice for data scientists for visualization, data analysis, and machine learning.

Hands-On Data Analysis with NumPy and Pandas starts by guiding you in setting up the right environment for data analysis with Python, along with helping you install the correct Python distribution. In addition to this, you will work with the Jupyter notebook and set up a database. Once you have covered Jupyter, you will dig deep into Python's NumPy package, a powerful extension with advanced mathematical functions. You will then move on to creating NumPy arrays and employing different array methods and functions. You will explore Python's pandas extension which will help you get to grips with data mining and learn to subset your data. Last but not the least you will grasp how to manage your datasets by sorting and ranking them.

By the end of this book, you will have learned to index and group your data for sophisticated data analysis and manipulation.

What you will learn

  • Understand how to install and manage Anaconda
  • Read, sort, and map data using NumPy and pandas
  • Find out how to create and slice data arrays using NumPy
  • Discover how to subset your DataFrames using pandas
  • Handle missing data in a pandas DataFrame
  • Explore hierarchical indexing and plotting with pandas

Who This Book Is For

Hands-On Data Analysis with NumPy and Pandas is for you if you are a Python developer and want to take your first steps into the world of data analysis. No previous experience of data analysis is required to enjoy this book.

Table of Contents

  1. Setting Up a Python Data Analysis Environment
  2. Diving into NumPY
  3. Operations on NumPy Arrays
  4. Pandas Are Fun! What Is pandas?
  5. Arithmetic, Function Application and Mapping with pandas
  6. Managing, Indexing, and Plotting


PDF Link - 

Python Coding challenge - Day 72 | What is the output of the following Python code?


Code - 

j = 1

while j <= 2 :

  print(j)

  j++

Explanation - 

It looks like there's a small syntax error in your code. In Python, the increment operator is +=, not ++. Here's the corrected version:


j = 1
while j <= 2:
    print(j)
    j += 1
This code initializes the variable j with the value 1 and then enters a while loop. The loop continues as long as j is less than or equal to 2. Inside the loop, the current value of j is printed, and then j is incremented by 1 using j += 1.

When you run this corrected code, the output will be:

1
2
Each number is printed on a new line because the print function automatically adds a newline character by default.

Friday, 17 November 2023

a = 10 b = 60 if a and b > 20 : print('Hello') else : print('Hi')

Code - 

a = 10

b = 60

if a and b > 20 :

  print('Hello')

else :

  print('Hi')


Explanation -


The above code checks the condition a and b > 20. In Python, the and operator has a higher precedence than the comparison (>), so the expression is evaluated as (a) and (b > 20).

Here's how it breaks down:

The value of a is 10.
The value of b is 60.
The first part of the condition, a, is considered "truthy" in Python.
The second part of the condition, b > 20, is also true because 60 is greater than 20.
So, both parts of the and condition are true, and the print('Hello') statement will be executed. Therefore, the output of the code will be:

Hello

a = 10 a = not not a print(a)

CODE - 

a = 10

a = not not a

print(a)


Solution - 

In the above code, the variable a is initially assigned the value 10. Then, the line a = not not a is used. The not operator in Python is a logical NOT, which negates the truth value of a boolean expression.

In this case, not a would be equivalent to not 10, and since 10 is considered "truthy" in Python, not 10 would be False. Then, not not a is applied, which is equivalent to applying not twice. So, not not 10 would be equivalent to not False, which is True.

Therefore, after the execution of the code, the value of a would be True, and if you print a, you will get: True 

Rewrite the following code in 1 line

 Rewrite the following code in 1 line

x = 3 y = 3.0 if x == y : print('x and y are equal') else : print('x and y are not equal')


In one line

x, y = 3, 3.0
print('x and y are equal') if x == y else print('x and y are not equal')

Explanation -

Initializes two variables, x and y, with the values 3 and 3.0, respectively. Then, it uses a conditional expression (also known as a ternary operator) to check if x is equal to y. If they are equal, it prints 'x and y are equal'; otherwise, it prints 'x and y are not equal'.

In this case, x and y are equal because the values are numerically the same, even though one is an integer (x) and the other is a float (y). The output of the code would be: x and y are equal

msg = 'Aeroplane' ch = msg[-0] print(ch)

msg = 'Aeroplane'

ch = msg[-0]

print(ch)


In Python, indexing starts from 0, so msg[-0] is equivalent to msg[0]. Therefore, ch will be assigned the value 'A', which is the first character of the string 'Aeroplane'. If you run this code, the output will be: A

Step by Step : 

msg = 'Aeroplane': This line initializes a variable msg with the string 'Aeroplane'.

ch = msg[-0]: This line attempts to access the character at index -0 in the string msg. However, in Python, negative indexing is used to access elements from the end of the sequence. Since -0 is equivalent to 0, this is the same as accessing the character at index 0.

print(ch): This line prints the value of the variable ch.

Now, let's evaluate the expression step by step:

msg[-0] is equivalent to msg[0], which accesses the first character of the string 'Aeroplane', so ch is assigned the value 'A'.

Therefore, when you run the code, the output will be : A


Python Coding challenge - Day 71 | What is the output of the following Python code?


Questions - 

for index in range(20, 10, -3):

    print(index, end=' ')

Solution - 

range(20, 10, -3): This creates a range of numbers starting from 20, decrementing by 3 at each step, until it reaches a number less than 10. So, the sequence is 20, 17, 14, 11.

for index in range(20, 10, -3):: This is a for loop that iterates over each value in the specified range. In each iteration, the variable index takes on the next value in the range.

print(index, end=' '): This prints the value of index followed by a space. The end=' ' argument is used to specify that a space should be printed at the end of each value instead of the default newline character.

When you run this code, the output will be:

Output :   20 17 14 11


Thursday, 16 November 2023

Process Data from Dirty to Clean


What you'll learn

Define data integrity with reference to types of integrity and risk to data integrity

Apply basic SQL functions for use in cleaning string variables in a database

Develop basic SQL queries for use on databases

Describe the process involved in verifying the results of cleaning data


There are 6 modules in this course

This is the fourth course in the Google Data Analytics Certificate. These courses will equip you with the skills needed to apply to introductory-level data analyst jobs. In this course, you’ll continue to build your understanding of data analytics and the concepts and tools that data analysts use in their work. You’ll learn how to check and clean your data using spreadsheets and SQL as well as how to verify and report your data cleaning results. Current Google data analysts will continue to instruct and provide you with hands-on ways to accomplish common data analyst tasks with the best tools and resources.

Learners who complete this certificate program will be equipped to apply for introductory-level jobs as data analysts. No previous experience is necessary.

By the end of this course, you will be able to do the following:

 - Learn how to check for data integrity.

 - Discover data cleaning techniques using spreadsheets. 

 - Develop basic SQL queries for use on databases.

 - Apply basic SQL functions for cleaning and transforming data.

 - Gain an understanding of how to verify the results of cleaning data.

 - Explore the elements and importance of data cleaning reports.

Analyze Data to Answer Questions


What you'll learn

Discuss the importance of organizing your data before analysis with references to sorts and filters

Demonstrate an understanding of what is involved in the conversion and formatting of data

Apply the use of functions and syntax to create SQL queries for combining data from multiple database tables

Describe the use of functions to conduct basic calculations on data in spreadsheets


There are 4 modules in this course

This is the fifth course in the Google Data Analytics Certificate. These courses will equip you with the skills needed to apply to introductory-level data analyst jobs. In this course, you’ll explore the “analyze” phase of the data analysis process. You’ll take what you’ve learned to this point and apply it to your analysis to make sense of the data you’ve collected. You’ll learn how to organize and format your data using spreadsheets and SQL to help you look at and think about your data in different ways. You’ll also find out how to perform complex calculations on your data to complete business objectives. You’ll learn how to use formulas, functions, and SQL queries as you conduct your analysis. Current Google data analysts will continue to instruct and provide you with hands-on ways to accomplish common data analyst tasks with the best tools and resources.


Learners who complete this certificate program will be equipped to apply for introductory-level jobs as data analysts. No previous experience is necessary.


By the end of this course, you will:

 - Learn how to organize data for analysis.

 - Discover the processes for formatting and adjusting data. 

 - Gain an understanding of how to aggregate data in spreadsheets and by using SQL.

 - Use formulas and functions in spreadsheets for data calculations.

 - Learn how to complete calculations using SQL queries.

JOIN FREE - Analyze Data to Answer Questions

Go Beyond the Numbers: Translate Data into Insights


What you'll learn

Apply the exploratory data analysis (EDA) process

Explore the benefits of structuring and cleaning data

Investigate raw data using Python

Create data visualizations using Tableau 

There are 5 modules in this course

This is the third of seven courses in the Google Advanced Data Analytics Certificate. In this course, you’ll learn how to find the story within data and tell that story in a compelling way. You'll discover how data professionals use storytelling to better understand their data and communicate key insights to teammates and stakeholders. You'll also practice exploratory data analysis and learn how to create effective data visualizations. 

Google employees who currently work in the field will guide you through this course by providing hands-on activities that simulate relevant tasks, sharing examples from their day-to-day work, and helping you build your data analytics skills to prepare for your career. 

Learners who complete the seven courses in this program will have the skills needed to apply for data science and advanced data analytics jobs. This certificate assumes prior knowledge of foundational analytical principles, skills, and tools covered in the Google Data Analytics Certificate.  

By the end of this course, you will:

-Use Python tools to examine raw data structure and format

-Select relevant Python libraries to clean raw data

-Demonstrate how to transform categorical data into numerical data with Python

-Utilize input validation skills to validate a dataset with Python

-Identify techniques for creating accessible data visualizations with Tableau

-Determine decisions about missing data and outliers 

-Structure and organize data by manipulating date strings


Join Free- Go Beyond the Numbers: Translate Data into Insights

Decisions, Decisions: Dashboards and Reports


What you'll learn

Design BI visualizations

Practice using BI reporting and dashboard tools

Create presentations to share key BI insights with stakeholders

Develop professional materials for your job search


There are 6 modules in this course

You’re almost there! This is the third and final course in the Google Business Intelligence Certificate. In this course, you’ll apply your understanding of stakeholder needs, plan and create BI visuals, and design reporting tools, including dashboards. You’ll also explore how to answer business questions with flexible and interactive dashboards that can monitor data over long periods of time.


Google employees who currently work in BI will guide you through this course by providing hands-on activities that simulate job tasks, sharing examples from their day-to-day work, and helping you build business intelligence skills to prepare for a career in the field. 


Learners who complete the three courses in this certificate program will have the skills needed to apply for business intelligence jobs. This certificate program assumes prior knowledge of foundational analytical principles, skills, and tools covered in the Google Data Analytics Certificate.  


By the end of this course, you will:

-Explain how BI visualizations answer business questions

-Identify complications that may arise during the creation of BI visualizations

-Produce charts that represent BI data monitored over time

-Use dashboard and reporting tools

-Build dashboards using best practices to meet stakeholder needs

-Iterate on a dashboard to meet changing project requirements

-Design BI presentations to share insights with stakeholders

-Create or update a resume and prepare for BI interviews

Join Free - Decisions, Decisions: Dashboards and Reports

Ask Questions to Make Data-Driven Decisions


What you'll learn

Explain how each step of the problem-solving road map contributes to common analysis scenarios.

Discuss the use of data in the decision-making process.

Demonstrate the use of spreadsheets to complete basic tasks of the data analyst including entering and organizing data.

Describe the key ideas associated with structured thinking.

There are 4 modules in this course

This is the second course in the Google Data Analytics Certificate. These courses will equip you with the skills needed to apply to introductory-level data analyst jobs. You’ll build on your understanding of the topics that were introduced in the first Google Data Analytics Certificate course. The material will help you learn how to ask effective questions to make data-driven decisions, while connecting with stakeholders’ needs. Current Google data analysts will continue to instruct and provide you with hands-on ways to accomplish common data analyst tasks with the best tools and resources.


Learners who complete this certificate program will be equipped to apply for introductory-level jobs as data analysts. No previous experience is necessary.


By the end of this course, you will:

- Learn about effective questioning techniques that can help guide analysis. 

- Gain an understanding of data-driven decision-making and how data analysts present findings.

- Explore a variety of real-world business scenarios to support an understanding of questioning and decision-making.

- Discover how and why spreadsheets are an important tool for data analysts.

- Examine the key ideas associated with structured thinking and how they can help analysts better understand problems and develop solutions.

- Learn strategies for managing the expectations of stakeholders while establishing clear communication with a data analytics team to achieve business objectives.


Join Free- Ask Questions to Make Data-Driven Decisions

Popular Posts

Categories

100 Python Programs for Beginner (49) AI (34) Android (24) AngularJS (1) Assembly Language (2) aws (17) Azure (7) BI (10) book (4) Books (173) C (77) C# (12) C++ (82) Course (67) Coursera (226) Cybersecurity (24) data management (11) Data Science (128) Data Strucures (8) Deep Learning (20) Django (14) Downloads (3) edx (2) Engineering (14) Excel (13) Factorial (1) Finance (6) flask (3) flutter (1) FPL (17) Google (34) Hadoop (3) HTML&CSS (47) IBM (25) IoT (1) IS (25) Java (93) Leet Code (4) Machine Learning (59) Meta (22) MICHIGAN (5) microsoft (4) Nvidia (3) Pandas (4) PHP (20) Projects (29) Python (929) Python Coding Challenge (351) Python Quiz (21) Python Tips (2) Questions (2) R (70) React (6) Scripting (1) security (3) Selenium Webdriver (3) Software (17) SQL (42) UX Research (1) web application (8) Web development (2) web scraping (2)

Followers

Person climbing a staircase. Learn Data Science from Scratch: online program with 21 courses